What is website analytics? (Learn its benefits, useful tools and key metrics to track)
 Cesar, Customer Support
Website analytics can feel like a tough subject to understand, but it’s surprisingly easy to get to grips with. And when you know what is happening on your website, you can make big data-driven performance improvements.
This guide will help you start with website analytics by teaching all the basics you need to know. You’ll learn what it is, key metrics, best practices, useful tools and more. Let’s dive in!
What is website analytics?
Website analytics is the process of collecting and reporting on user data to measure your website performance.
Collecting the right metrics can show you:
How people use your site
The channels that generate the most website traffic
Your highest-performing content
How your website leads to conversions
Use this information to optimize your website, so it pushes you toward your business goals.
If you’re new to web analytics, this article will likely contain terms you haven’t seen before. With that in mind, here are definitions of the key web analytics terms you’ll see in this article.
Data: The information collected by your website, platforms, and tools
Conversion: When someone takes the action you want them to take on your website. For example, buys your product or downloads a lead-gen form.
Metrics: A measurable data point. For example, monthly organic traffic
Goals: Long-term outcomes you want your business or website to achieve
Segments: A section of users or website visitors grouped due to similar characteristics
Example website analytics metrics to track performance 📈
Website analytics tools provide access to tons of data points, but it’s not necessary to track them all. Start by following some of these key website performance metrics—just choose the ones most relevant to your business.
Unique visitors
The number of people who visit your website in a period. Track this metric over time to see the impact of your acquisition strategies.
New vs. total users
Compare the total number of users who visited your site vs. the number of new users to see how you retain users over time. Funnel web traffic to your social channels or email newsletter to increase return visits. You can also look at sessions per user to see how often people view your site.
Location
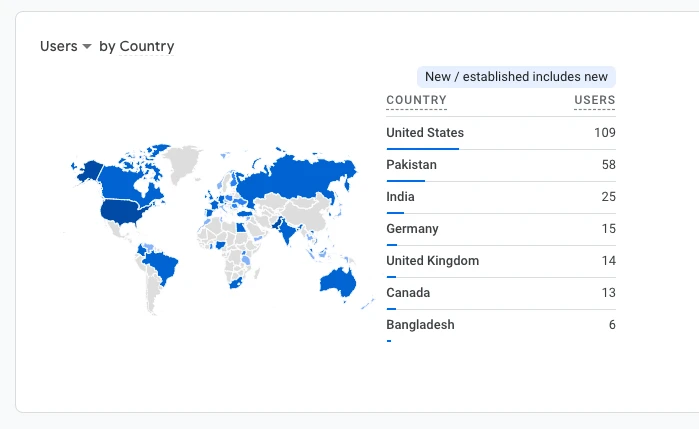
The country and city where your website visitors are based. Keep track of this metric if you need to bring in visitors from a specific area.
Demographics
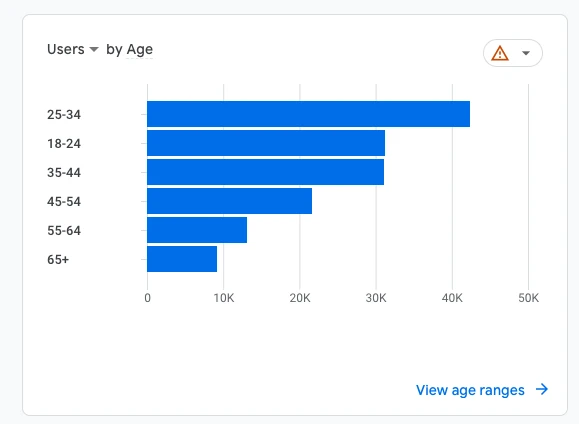
Information about your visitors including age, gender, and interests. See whether you attract the right people or tailor your content toward those already visiting your site.
Traffic source
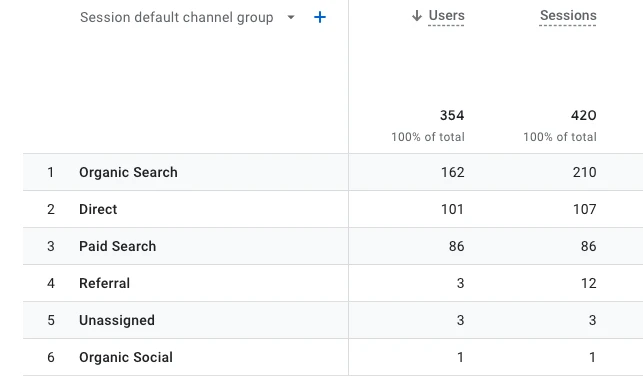
The channels people use to visit your website such as search engines, referrals, social media or email. Measure the impact of your acquisition strategies and see how visitors from each channel behave on your website.
Bounce rate and engagement time
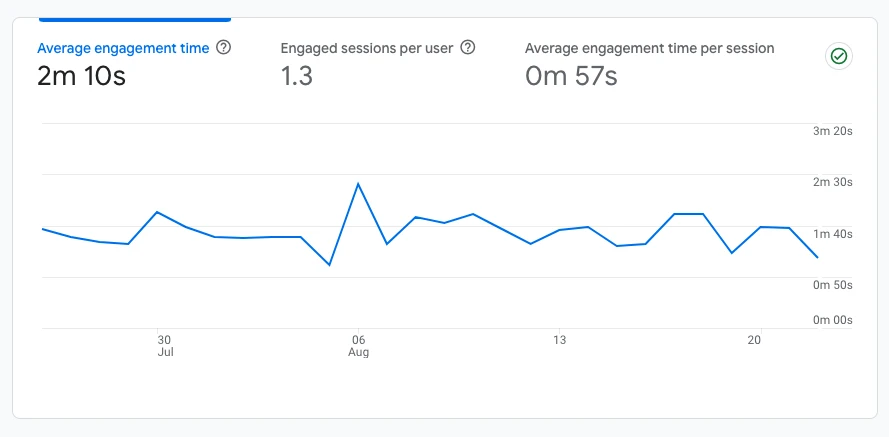
Bounce rate is the percentage of visitors who leave your site without taking action. Engagement time shows how much engaged time people spend on your site. A high bounce rate or low average time can mean your content isn’t interesting to visitors.
Exploration reports
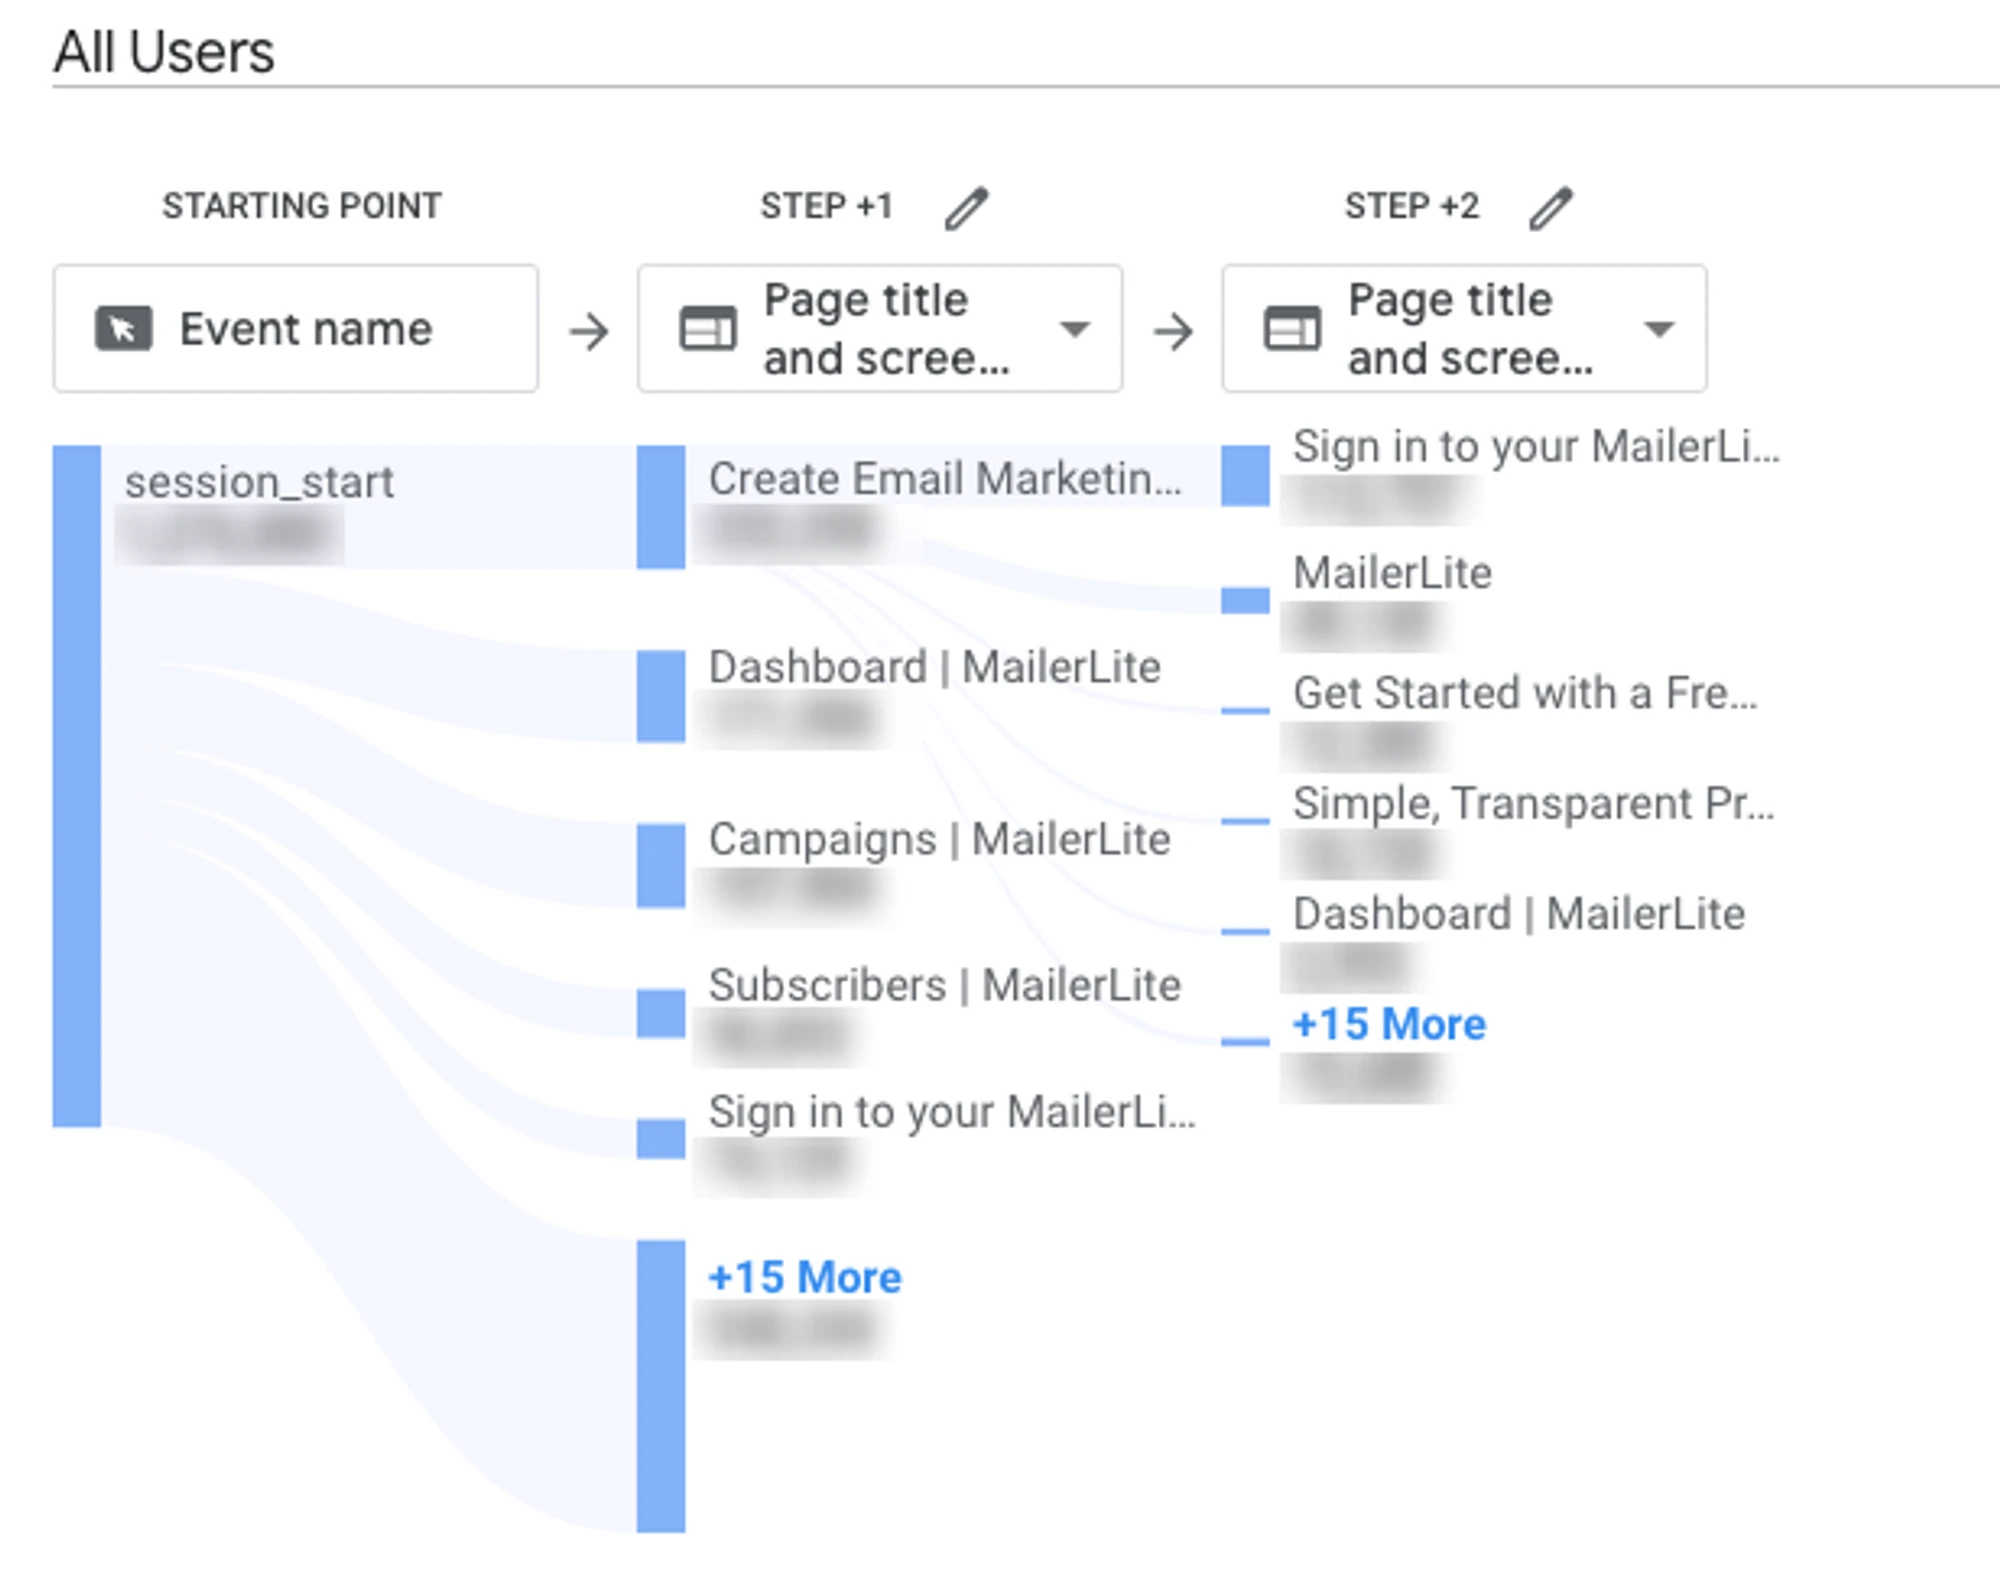
This Google Analytics 4 feature highlights how people move around your site. Use it to track the customer journey and see where people are dropping off.
Heat maps
A visual representation of how people interact with a specific page on your site. Use alongside A/B tests to optimize your pages.

Anyone with a MailerLite website or landing page can access heat maps to see how people interact with their pages. Enable heat maps by clicking the Edit settings button in your website overview, heading to the Analytics and Custom code tab, and then toggling Click heat maps to on.
Events
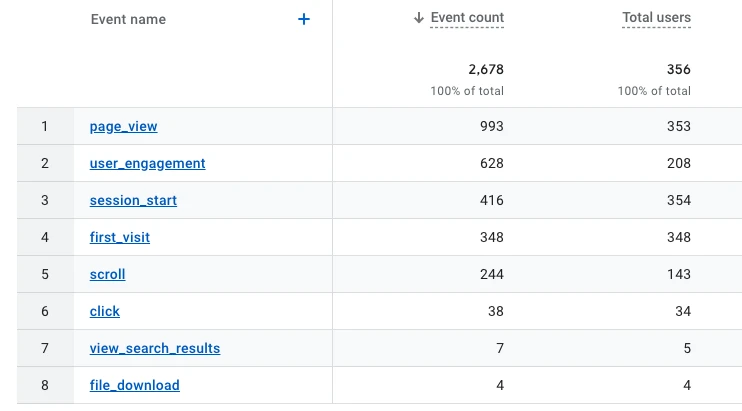
Events reports show the actions people take when they visit your website. They highlight actions such as link clicks, form submissions or video views. Use this metric to check website visitors are taking the actions you want them to take.
Sales and e-commerce data
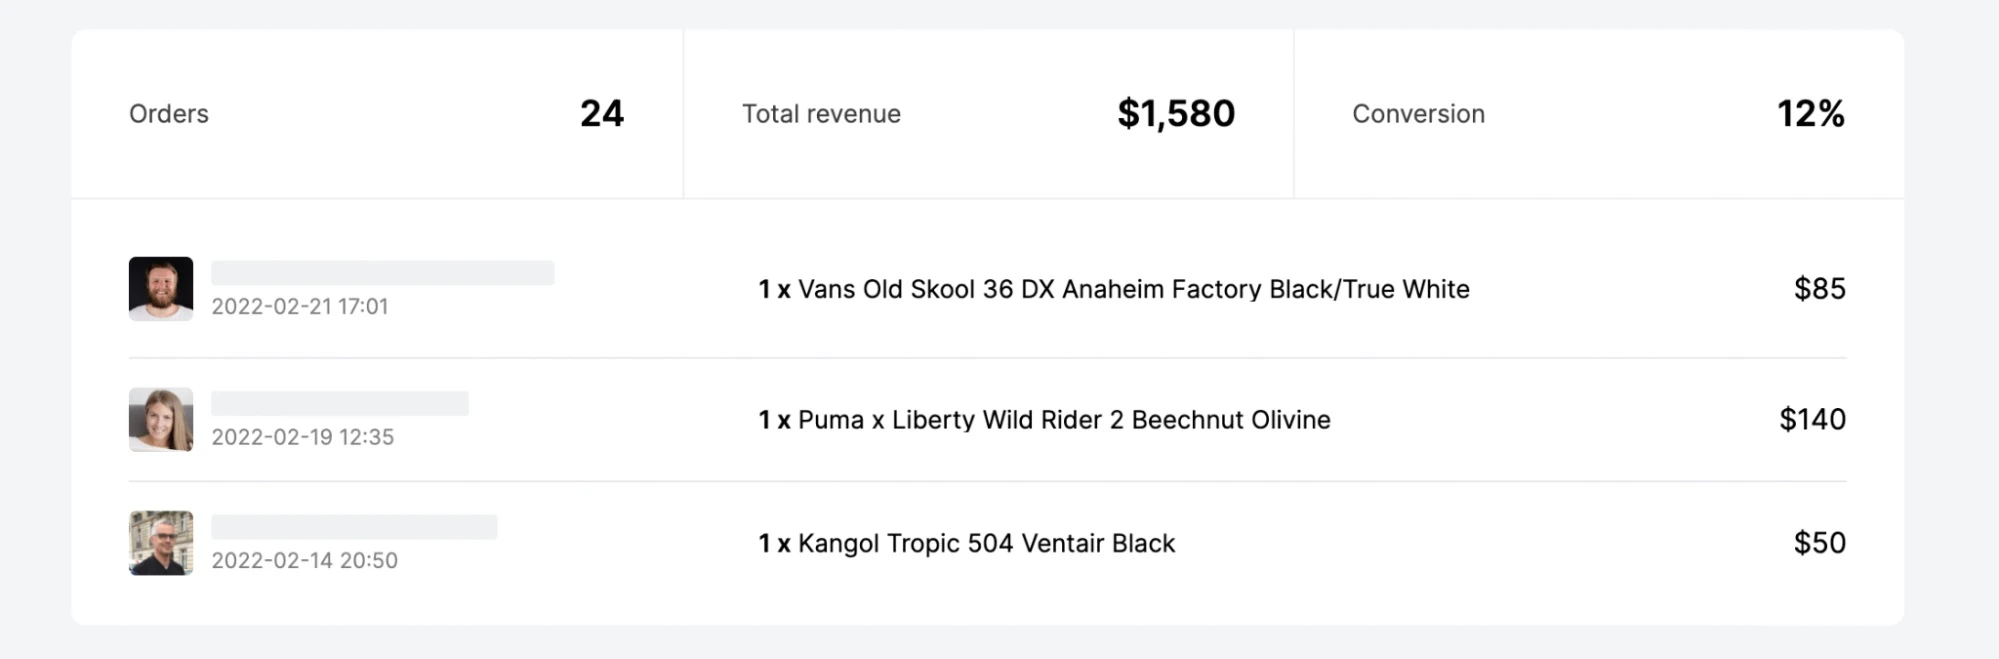
Orders, total revenue, and conversions show your site’s e-commerce performance. This data is useful for both physical and digital products.
In MailerLite, you can reset your website, landing page and form analytics so that all the activity recorded during set-up and testing can be cleared before the official launch.
Mastering web analytics has many benefits
Web analytics helps you understand website performance, which can benefit your business in several ways. Here are 4 of the main improvements you’ll make when you start tracking how people use your website.
1. You’ll understand user behavior
When you created your website, you probably had a specific idea about how people would use it.
For example:
E-commerce stores want people to click from their homepage to product pages and then to the checkout
Service companies want people to visit the landing page and sign up for a consultation
But without website analytics, you have no idea if people are doing what you want them to do.
Analyzing visitor behavior provides this insight. You can then optimize the user experience to encourage the behaviors you want people to take.
2. You can see high-traffic pages
Web analytics shows you which pages on your website generate the most traffic. You can do two things with this information:
Optimize your high-traffic pages to increase conversions
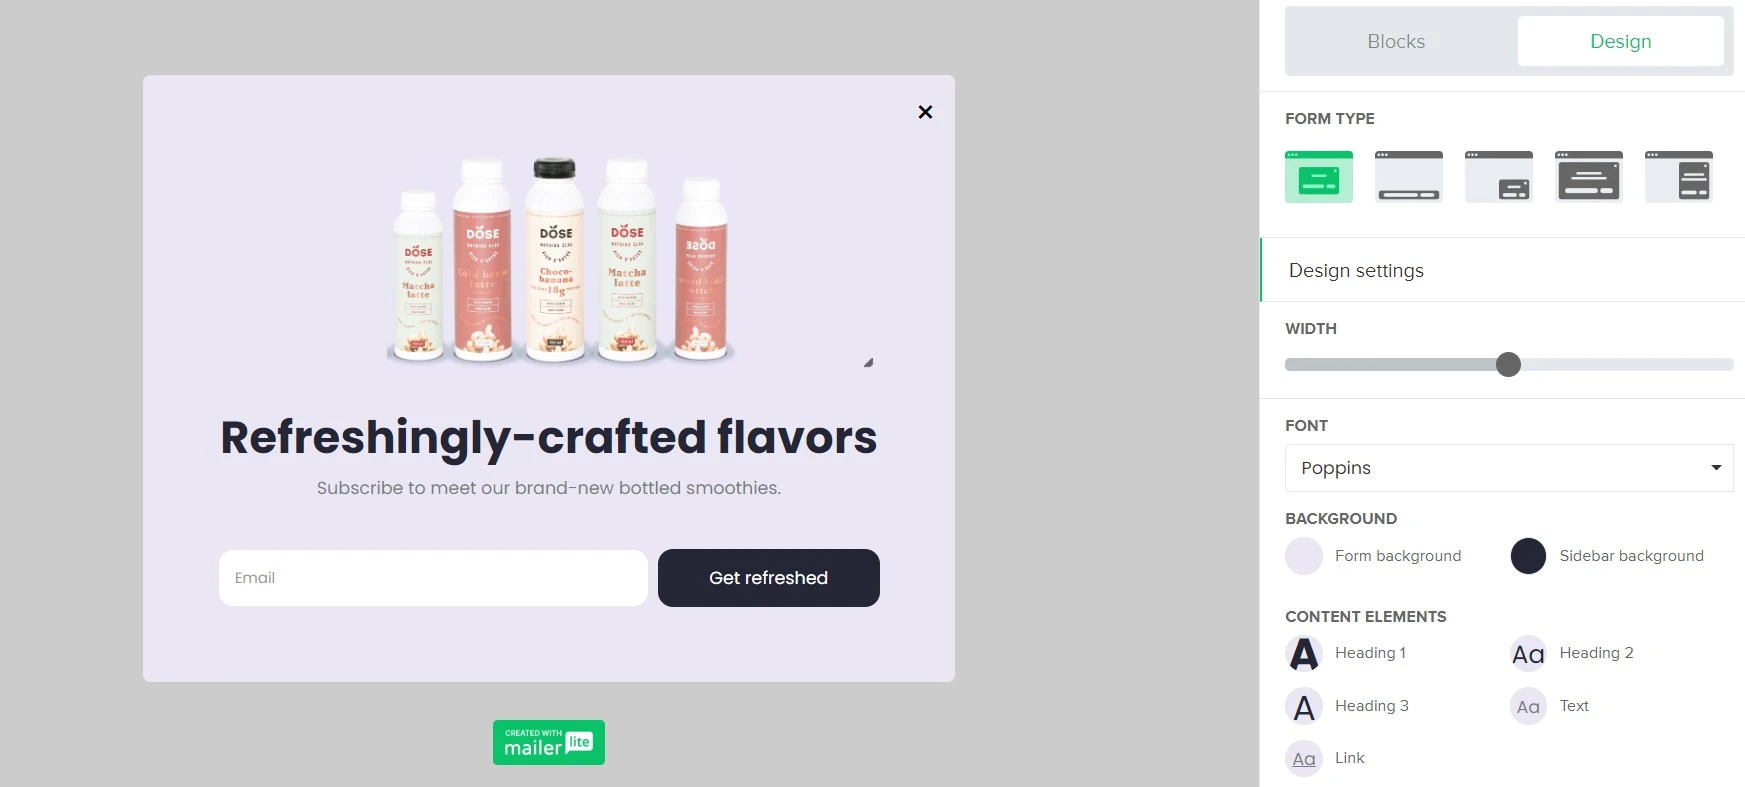
Creating offers relevant to the content on your high-traffic pages can drive conversions. Adding forms and popups to promote these offers will increase their visibility.
MailerLite’s signup forms make it easy to create these elements for any type of website—whether you use MailerLite’s website builder or a third-party platform like WordPress or Shopify (we even have a WordPress plug-in to simplify setup).
This article has all you need to know about optimizing your signup forms.
Create similar content that will resonate with your audience
Identifying high-traffic pages shows what types of content your audience likes so you can make more of it.
Imagine a personal trainer who creates content on nutrition, exercise, and mindfulness. Web analytics shows which categories resonate with their audience most so they can then focus on the most impactful topics.
3. You can identify the best-performing traffic sources
Most websites bring in traffic from multiple sources. But different sources generate different types of users, and they may not all equally contribute to your business goals.
Web analytics shows two important things:
The exact traffic sources that people use to visit your website.
How people from each traffic source behave on your site.
With this information, you can focus your marketing efforts on the channels that bring the most value. Put more effort into the traffic sources that work, and move away from those that don’t.
You can also use website analytics to track the impact of new acquisition strategies. For example, if you start a newsletter to push visitors to your site, you can see whether it results in the expected traffic.

4. You can make data-driven decisions
Website analytics allows you to make data-driven decisions rather than just guessing at the steps that might improve your business. This helps you spend your time and money on the actions that matter.
For example, if you want to invest more in promoting your website, look at your website data to see which of your current marketing campaigns are performing well. You can then direct resources to the channel that is most likely to generate results.
Website analytics best practices
By now you should have a pretty good idea about what website analytics is and some of the metrics you can track. Before you start tracking, here are 5 website analytics best practices to ensure you make the most of your efforts.
1. Ensure tracking accuracy
Check your data analytics tool is set up correctly by visiting a few pages on your site and checking that the visits show up in the tool. Also, be sure to test any custom events you’ve set up to track conversions as any issues in setup will result in incorrect data.
If you’re unsure about how to set up your website analytics tools, you can hire an agency or consultant to do the work for you. They’ll be able to set up tracking and ensure its accuracy so you can access reliable metrics. Check our database of experts to find someone to help.
2. Keep privacy compliant
You may need to use a cookie consent popup to stay privacy compliant depending on the tool you use and how you process the data it collects.
You can use MailerLite’s built-in analytics and privacy-focused tools like Fathom Analytics and Plausible Analytics without first getting tracking consent.
Google Analytics 4 can be used without consent if you have the IP anonymization feature turned on and you don’t share the data you collect with other tools, including Google’s own services.
3. Set goals and track relevant metrics
Avoid data overwhelm by choosing a few metrics that align with your business goals and focus on tracking and improving these numbers.
Read our article on website KPIs for more about choosing metrics that align with your goals.
4. Take action
Tracking analytics won’t improve your website on its own. You need to use this data to take steps and implement strategies that push you forward.
For example, if your site has growing traffic but a high bounce rate, ensure that people can find what they are looking for on your page.
Or perhaps you have a particular webpage that leads to high conversions. In this case, analyze what makes it work and then roll this out to your other pages.
5. Create effective reports
Reports make it easy to track your website analytics and share data with others in your organization. Just be sure to provide context and insight when creating reports.
For example, here is some context you could include when creating a report that shows website traffic:
Traffic from previous periods to show why your current website traffic is so impressive
Conversions and sales to show how the traffic drives business results
The strategies you put in place that led to the traffic increase
Trends and seasonal factors that could have impacted the results
People reading your report will be better placed to understand the data you are showing them when you include this information.
7 top website analytics tools
There are plenty of web analytics tools available. MailerLite users can access built-in analytics on their websites, and many sites use Google Analytics as it’s free, easy to get started with, and gives access to many advanced reports.
But there are also plenty of other tools that offer unique functionality. Here are some of the best website analytics tools to consider.
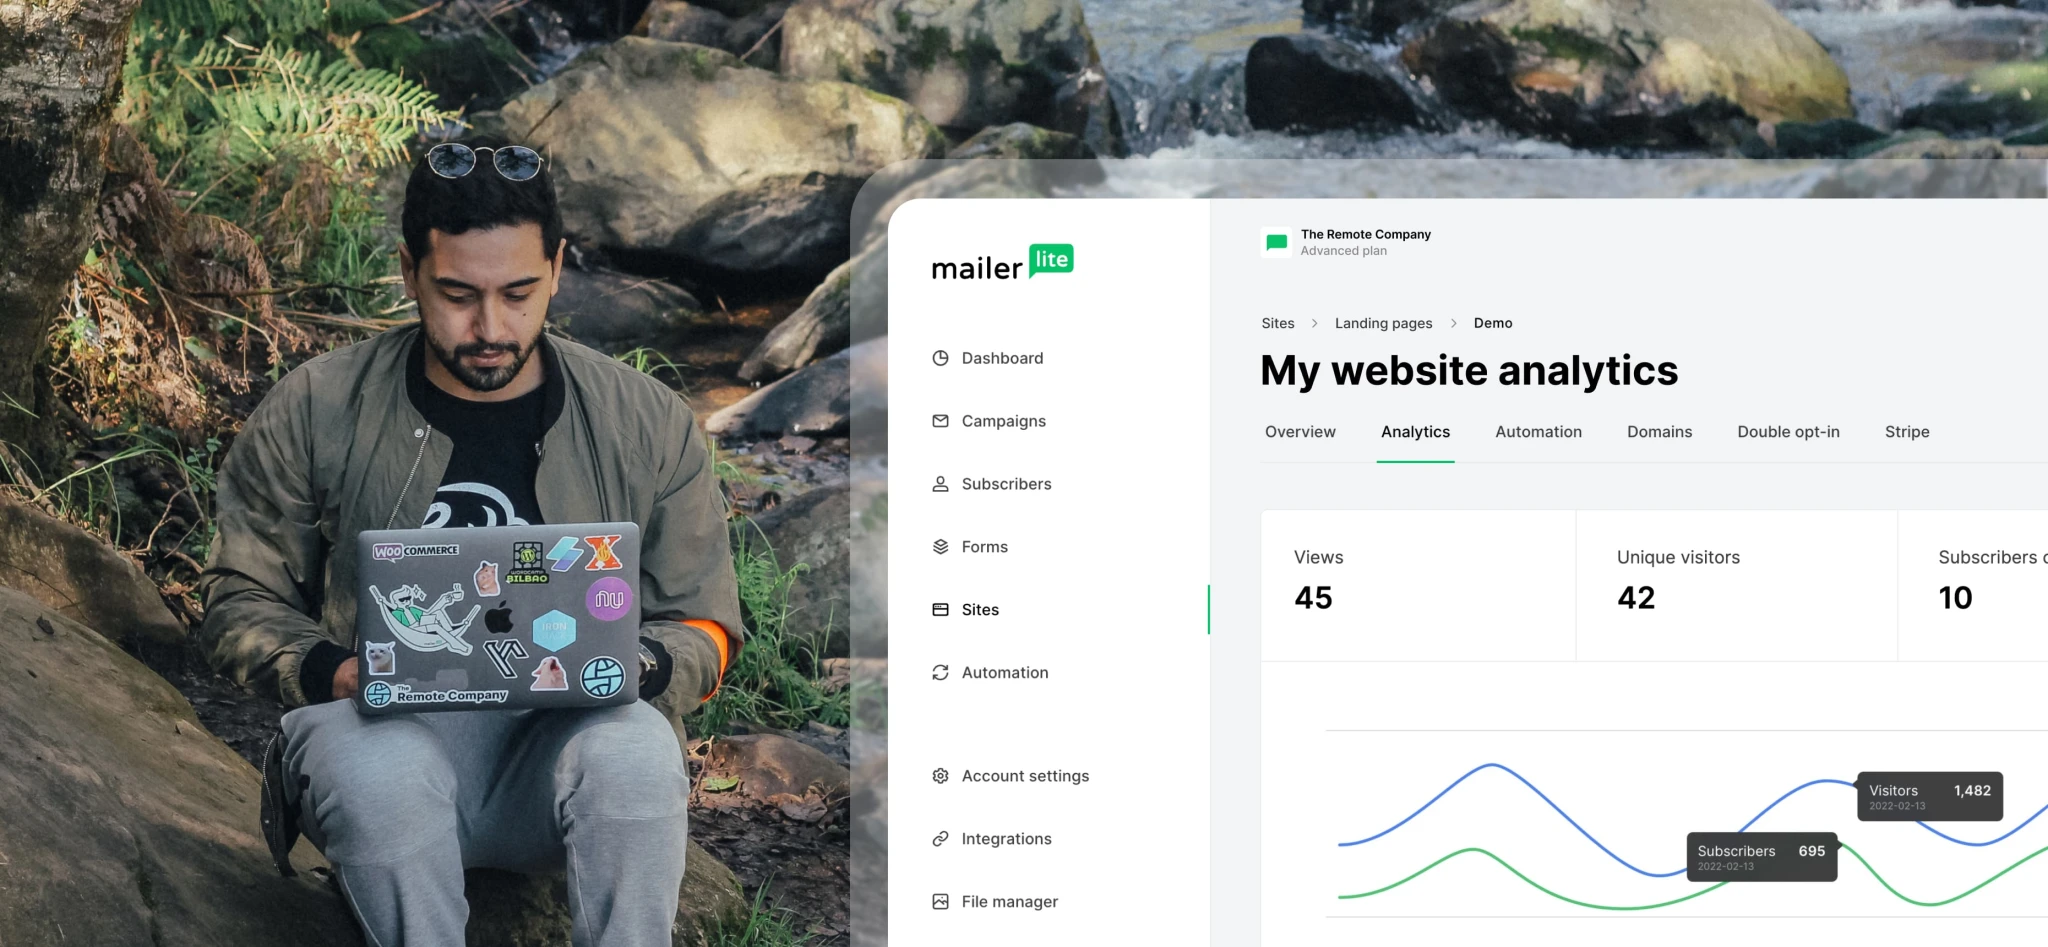
MailerLite: Easy analytics for MailerLite websites
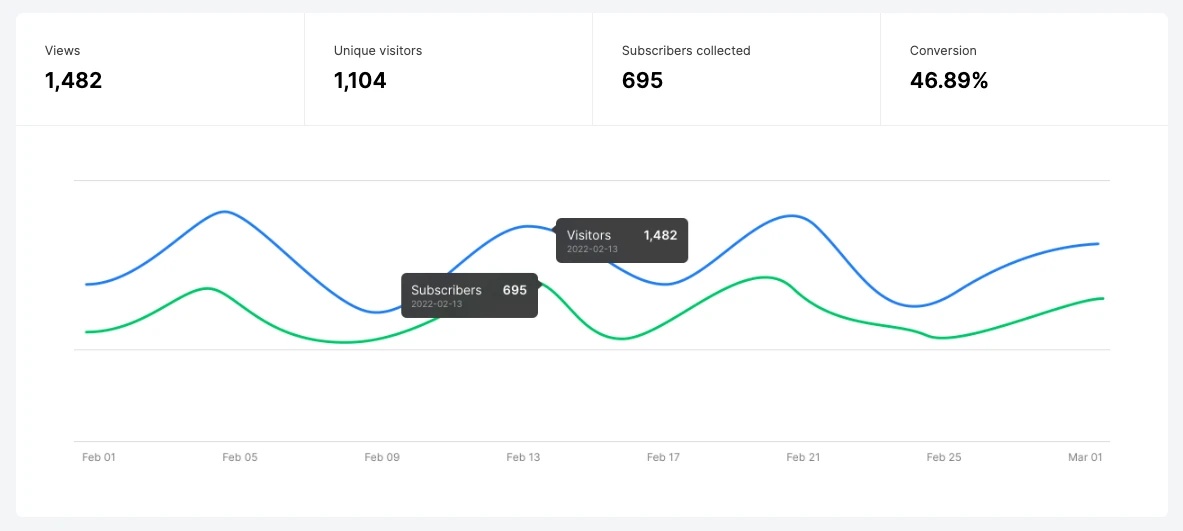
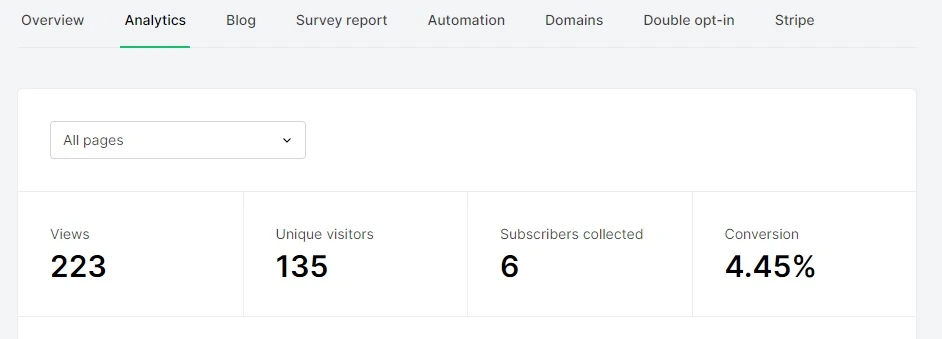
If you built your website or landing page with MailerLite, you can access plenty of analytics from within your dashboard. There’s no extra cost to view this data and it doesn’t require any extra setup.
Metrics you can access include unique visitors and views for any page on your website and how well your site converts visitors into email subscribers. You can even view heat maps to see user interaction.
If you need more detailed reports, it’s also easy to add other website analytics tools such as Google Analytics by copying and pasting the tracking code into the Header code injection section of your website settings.
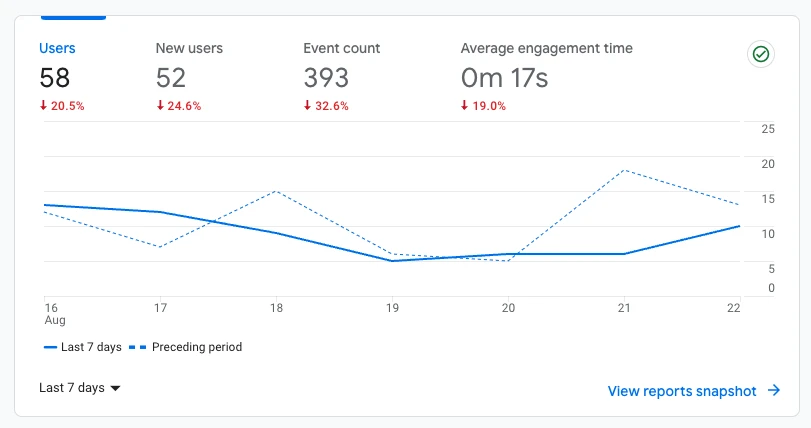
Google Analytics: Popular and free website analytics platform
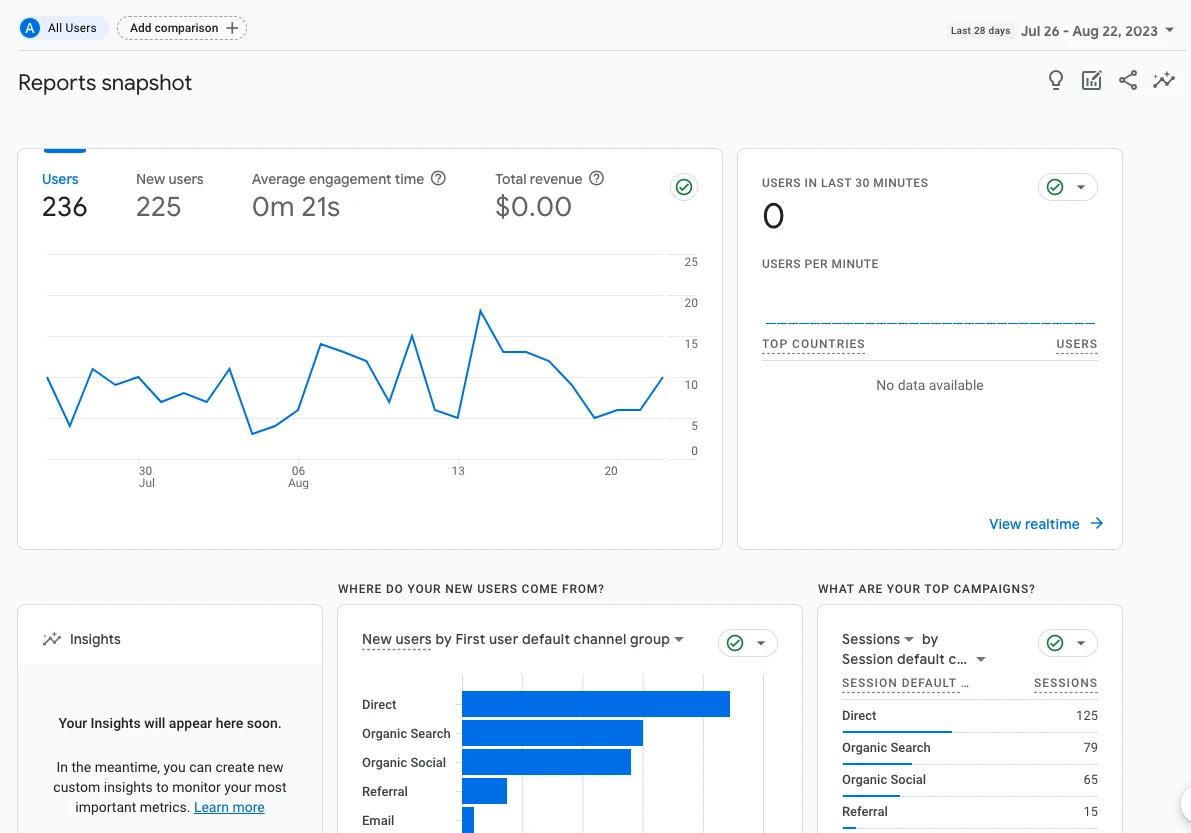
Google Analytics is the most popular analytics platform. It’s free and provides insight into users, website behavior, and acquisition.
One of the most powerful ways to use Google Analytics is to set up custom events and then use these to track conversions on your website. By comparing different pages, you see how each page on your website performs for a specific event.
Google Search Console: Analyze search performance
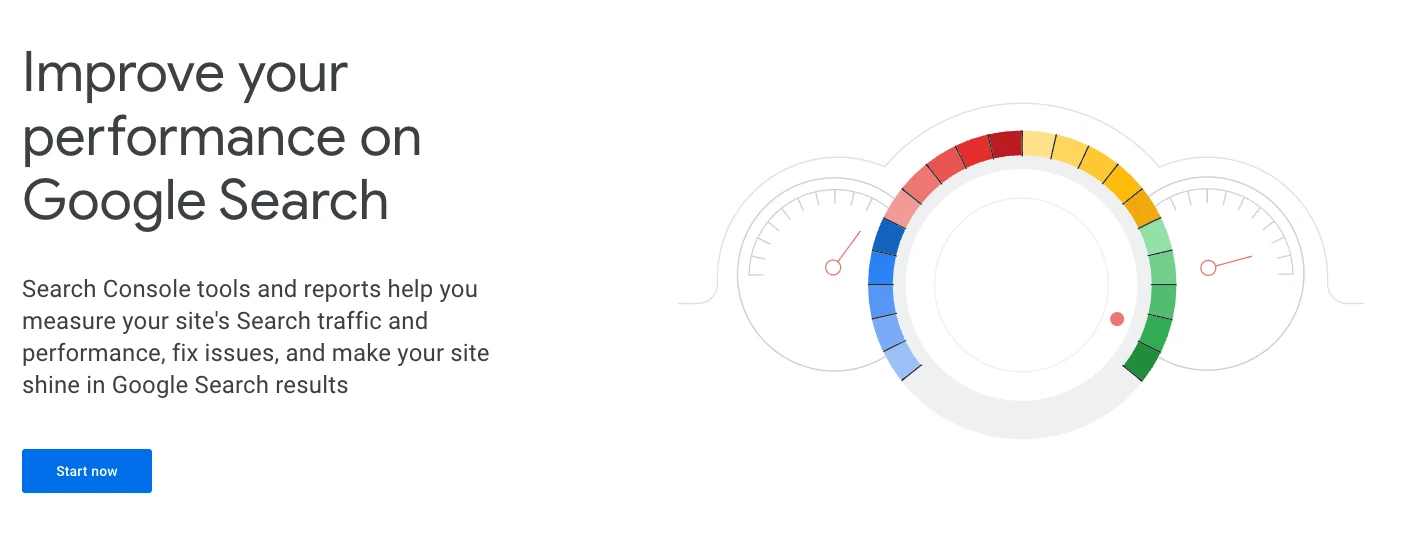
Search Console is a free tool from Google that provides insight into how your site performs on Google Search. You can see queries your site shows up for, as well as the number of impressions and clicks for each term.
The tool also highlights potential issues around page speed, indexing and backlinks that could hurt your website’s visibility on Google. It’s an essential tool if you use a Search Engine Optimization (SEO) strategy to generate traffic.
Fathom Analytics: Privacy-focused web analytics software
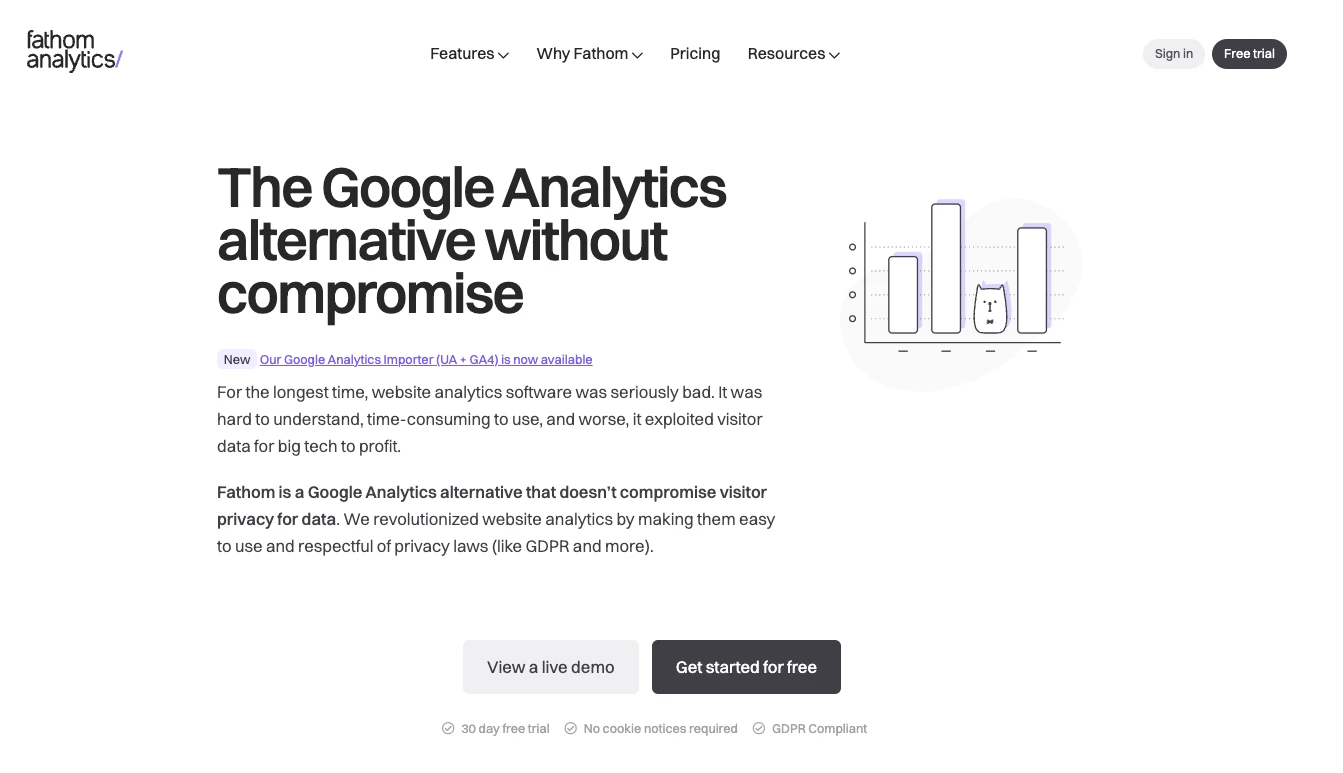
Fathom Analytics is a website analytics platform that prioritizes data privacy. The way the tool collects data means you don’t need to add a cookie banner to your site to request permission to track the user. Pricing starts at $14 a month for up to 100,000 page views.
Hotjar: Track website traffic and sessions

Hotjar is a behavior analytics tool with features that help you understand how people interact with your website.
Heat maps highlight each page’s most popular content, user recordings show exactly how people interact with your website, and surveys allow you to collect user feedback from people visiting your website.
You can try the tool for up to 35 daily sessions for free and paid plans start at $39.
Plausible Analytics: Lightweight, privacy-focused platform
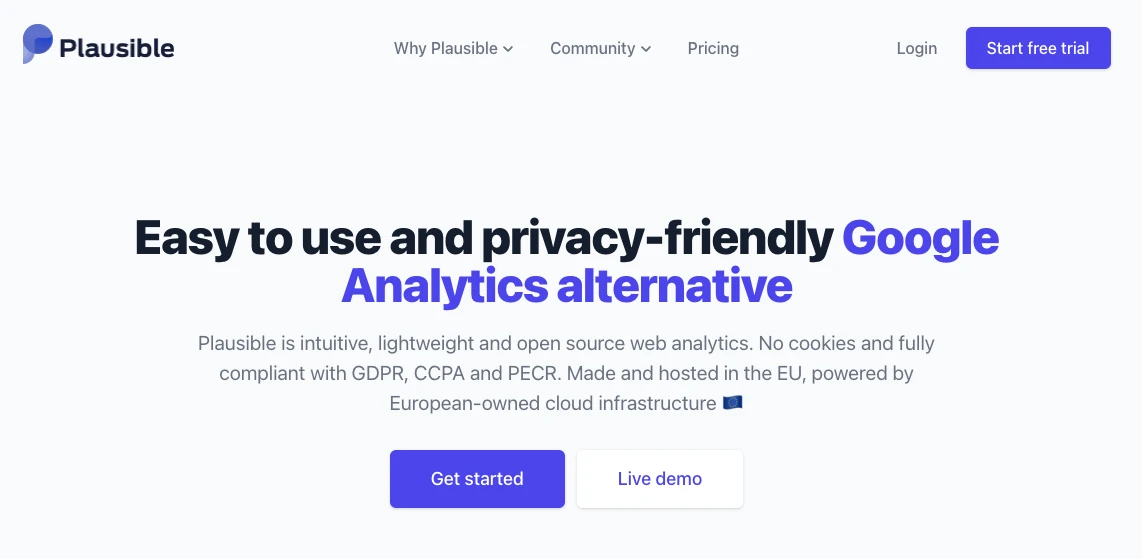
Plausible Analytics is another privacy-focused analytics tool that highlights all the data you need such as views, users, traffic source, and bounce rate.
The tool claims its analytics script is 45 times smaller than the one used by Google Analytics, which can result in a faster-loading website. Like Fathom Analytics, the way Plausible tracks users means you don’t need a cookie banner.
Pricing starts at $9 per month for up to 10,000 monthly users.
Looker Studio: Create web analytics reports

Looker Studio is a free Google tool that lets you import data from your analytics platform and then create visual reports to highlight the metrics you choose in any way you want.
Once you’ve created these dashboards and reports, share them with people in your organization so everyone can benefit from your website analytics data.
Your website analytics journey is only beginning🚀
We hope this article has clarified some key ideas about web analytics and how it benefits your website.
For the next steps, we recommend setting up Google Analytics if you haven’t already. You can then explore the analytics data points to begin to understand more about your website performance.