9 easy-to-track website KPIs (and when you should use them)
 Alex, Customer Support
Running a website is a constant learning experience. There’s a lot to get to grips with, from setting up your site to creating content and tracking website KPIs.
But, when it comes to website tracking, there are two lessons most people pick up quickly:
You can track pretty much everything
Actually doing so is a terrible idea
A much better option is choosing a few essential website key performance indicators (KPIs) to follow.
Website KPIs are metrics that help you understand your site’s performance. Tracking them over time shows how your conversion, engagement and acquisition strategies impact your website. You can use this data to inform your future optimization efforts.
This article will teach you how to choose website KPIs and introduce 9 key metrics to consider tracking.
A simple way to decide which website KPIs to track
Management consultant Peter Drucker once said, “What gets measured gets improved.”
The phrase is a reminder to track the metrics that push you toward your goals.
This quote is especially relevant to website KPIs—the vast amount of data available means it is easy to focus on the wrong things.
But there is a simple way to ensure you choose the right metrics. You just need to understand:
The website conversions that help you meet your business goals
The behaviors that lead to website conversions
With this information, you can then choose the most impactful KPIs.
Imagine you own a professional service business and use your website to bring in potential customers.
Because your goal is lead generation, you need to define the website behaviors that result in a visitor converting into a lead.
People who turn into leads may:
👉 Look at several pages on your website
👉 Return to your website multiple times
👉 View your pricing page
👉 Download your lead magnet. For example, a content calendar template.
Once you identify these behaviors, you can choose website KPIs that reflect these actions.
For example:
👉 Pages per session shows if users are viewing multiple pages
👉 Sessions per user highlights if people are returning to your website
👉 Pricing page users shows how many people visit your pricing page
👉 Lead magnet downloads is the number of leads you generate
Improving any of these metrics will increase conversion. And tracking them over time shows the impact of your website optimization efforts.
Different types of websites have unique goals, so you should measure the KPIs that reflect them.
An ad-monetized website will focus on ad revenue as the primary goal. But users, page views, sessions per user, newsletter signups and time spent on page are useful because increasing these factors will result in more ad income.
Alternatively, if you sell digital products, sales will be your main KPI. But you could also track metrics like pages per user, product page views and product video views.
Quantifiable: There should be a clear way to measure the metrics
Actionable: They should offer insight that provides a way forward for your team
Related to your goals: There should be a relationship between the KPIs and your goals
9 website KPIs to track performance
The best web KPIs to track depends on your business. This section will introduce 9 common metrics we think most companies will find useful.
We’ve split these KPIs into the following four categories based on the type of information they highlight.
These are:
Traffic and audience KPIs
Acquisition KPIs
Engagement KPIs
Conversion KPIs
You don’t need to track all the KPIs in this article. But measuring some from each category will help you understand overall website performance.
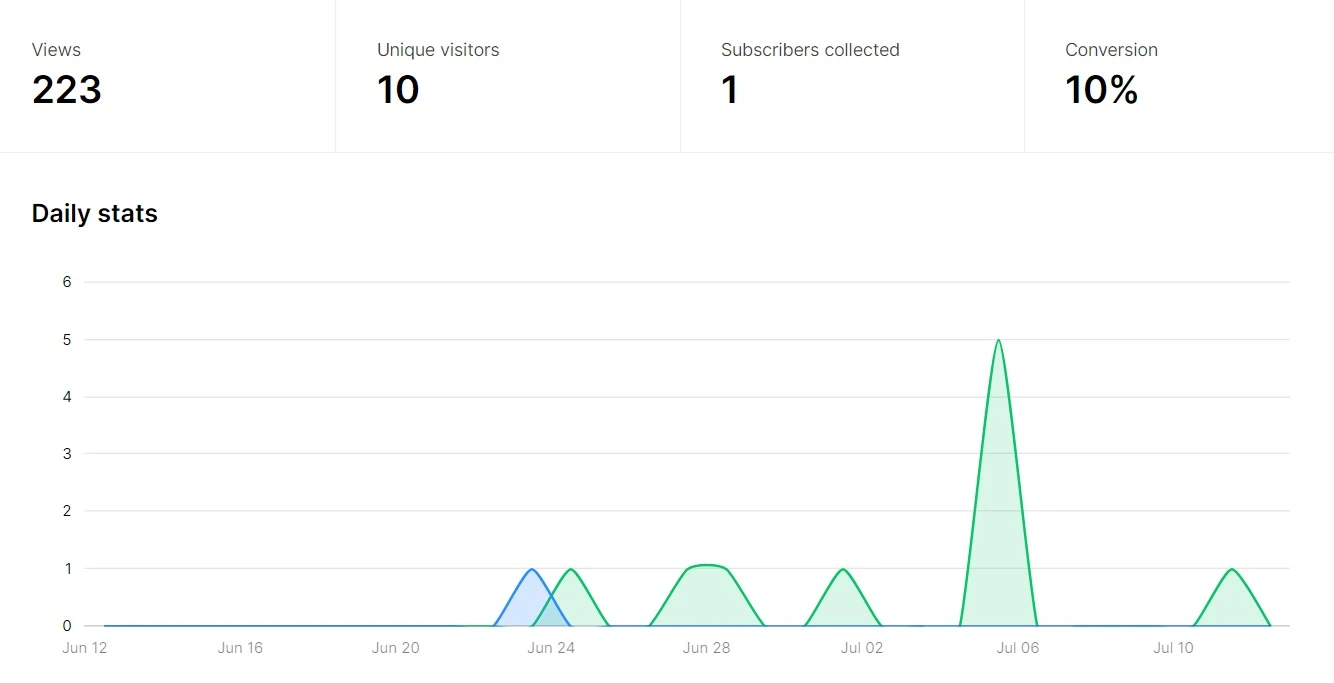
If you used MailerLite’s website builder to create your website, you have access to essential website metrics within your dashboard. You can see page views, unique visitors, email conversion rate, and email subscribers.
For further data, you need to integrate your website with an analytics tool like Google Analytics. You can do this by clicking on “Edit settings,” then “Analytics and custom code,” and adding your Google Analytics tracking ID to the relevant section. This video shows you how to integrate Google Analytics with MailerLite.
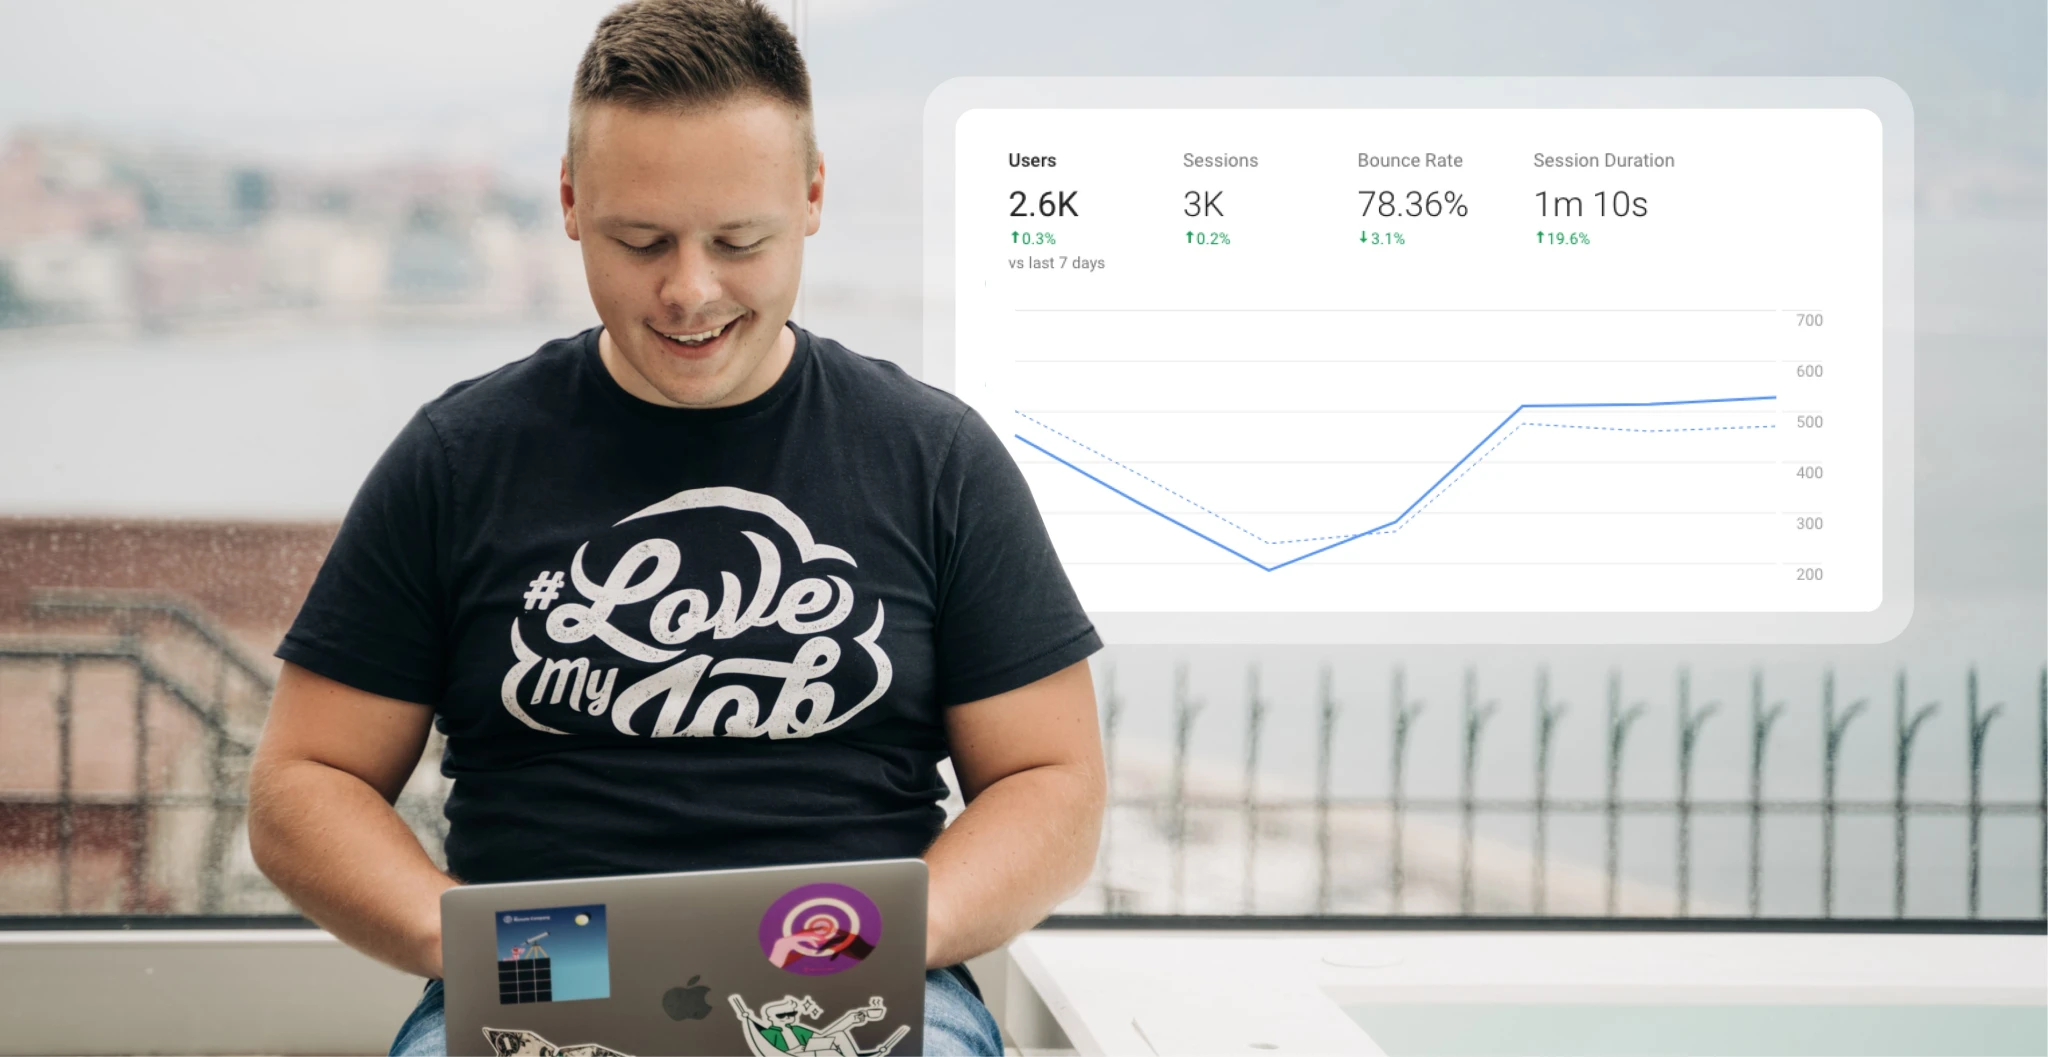
Traffic and audience KPIs
Traffic and audience KPIs show how well your website attracts visitors and whether it attracts the right people.
1. Users
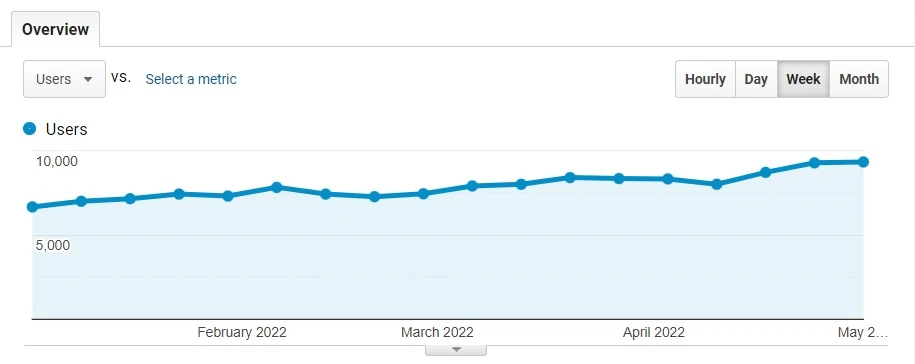
Users is the total number of people who visit your website in a given period. It’s an important metric to track because no matter what your website goals are, you need users to achieve them.
Tracking users shows the overall impact of your marketing and brand awareness strategies. And it highlights how seasonality impacts your website.
You can also track how many users visit specific pages. This is useful if your sales funnel involves sending users to a particular page, such as a product landing page. You’ll see how effective the funnel is and the impact of optimizations.
The issue with tracking users is that while it shows growth, it doesn’t provide insight into the value of a visitor.
This is ok if your website is monetized via ads and you want to maximize impressions. But if your website relies on conversions, you’ll need to dig deeper into your web analytics platform to see how visitors behave. We have more on how to do this later in the article.
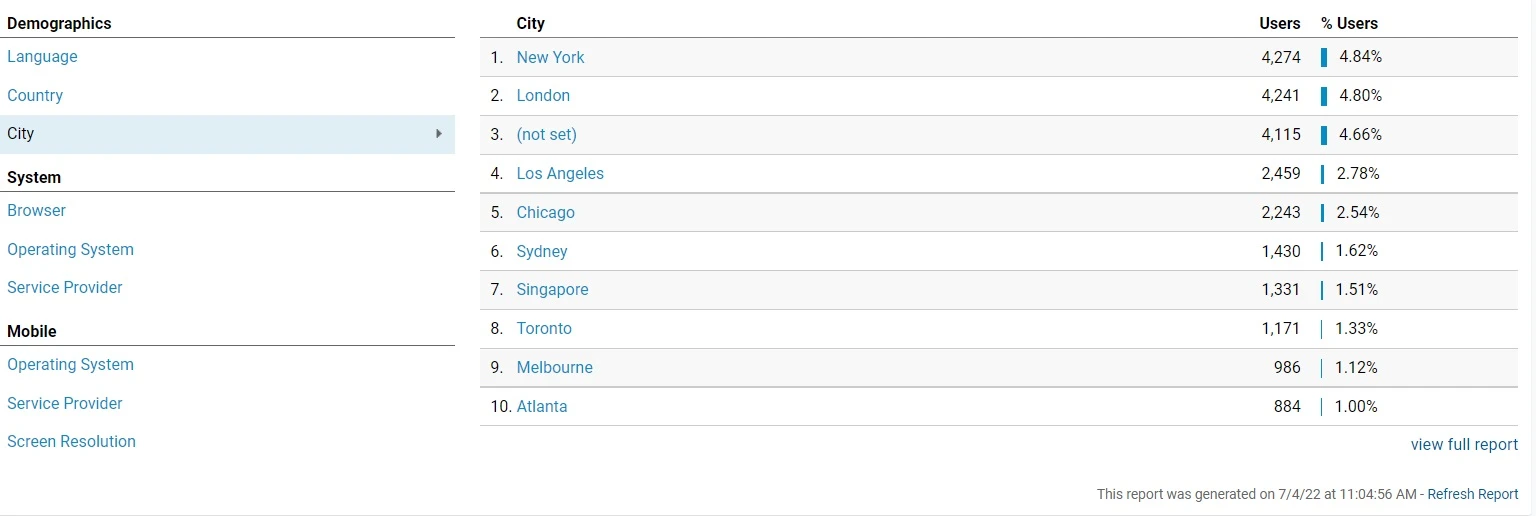
2. Demographics
Demographics data shows information about the type of people that visit your website. This is useful for two reasons:
You can check if your website is attracting the right type of people
You can create content that appeals to the people who already visit your website
Google Analytics shows data about the visitor’s country, language, and city by default. This is useful for any website that needs to attract visitors from a specific location.
For example, a local services business will want to ensure that the majority of its visitors are coming from the area it operates in.
You can also use location data to spot opportunities. If an e-commerce store gets a lot of visitors from a country outside its current delivery range, it could look into ways to expand delivery to these areas.
Demographics data goes beyond location: you can also collect information about your visitors’ age, gender, and interests. This provides further detail about who is visiting your website.
To set this up, enable it within your Google Analytics account and then update your privacy policy.

Acquisition KPIs
Acquisition KPIs show which channels attract the most users. Use this information to see how each type of traffic performs. You can then double down on your highest-performing channels.
3. Traffic by source
Traffic by source shows where your website traffic comes from. It also lets you compare performance across different channels.
With this information, you see which channels bring in the most visitors, measure the impact of traffic acquisition campaigns and identify the most valuable types of traffic.
All Google Analytics dashboards show the following acquisition sources:
🎯 Direct: Traffic is listed as direct when Google has no information about the source. Typically this is when someone types your URL into their browser.
🔎 Organic Search: Traffic from search engines like Google, Bing, and Yahoo. Use this to measure the impact of your SEO efforts.
Read this article for a beginner guide to SEO basics.
➡️ Referral: Traffic that comes via pages on other websites.
💬 Social: Traffic from social media sites like Facebook, Pinterest, LinkedIn and Instagram.
❓ Other: Traffic that doesn’t match any description. Click on the report to find out more about the traffic sources.
You may also see reports for other types of traffic if you run relevant campaigns and have configured your dashboard to track them.
📧 Email: Traffic generated from your email marketing campaigns.
💰 Paid search: Traffic that comes from your search engine ads.
💻 Display: Traffic generated when someone clicks on a display ad you ran on another website.
Many websites use email newsletters to generate traffic. Unfortunately, Google Analytics doesn’t track email visits out of the box. This traffic is typically marked as direct instead.
But, it’s easy to set up email tracking via your email service provider. With MailerLite, just enable UTM tracking from within your campaign options. Find out how to set up email tracking in Google Analytics at the link below.

Engagement KPIs
Engagement KPIs like pages per session, bounce rate, average time on page and sessions per user show how visitors interact with your website.
Good engagement KPIs suggest visitors enjoy your content and can be a precursor to conversions. Low engagement KPIs hint at problems with your content or audience targeting.
4. Pages per session
Pages per session shows the average number of pages website users visit in a single session.
It is an important metric to track if your goal is building engagement. People who read multiple pages enjoy your content and want to read more.
Having a high number of pages per session can also be a leading indicator for conversions. Someone who looks at a blog post, product page and then pricing page is more likely to convert than someone who reads a blog post and then leaves.
There are many ways to increase this metric. At MailerLite, we increase pages per session on our website by interlinking, highlighting relevant articles and ensuring our menu bar is always visible.
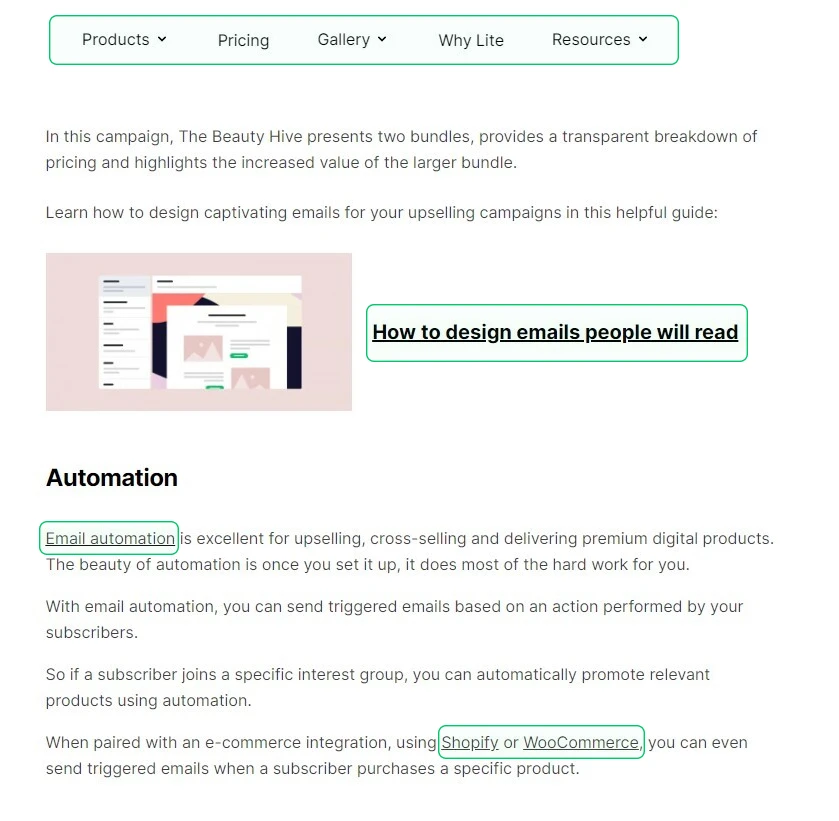
Improving your website structure can also help increase pages per session. Adding features like a clear navigation menu and call-to-action buttons help people move around your website. Find out more about key website structure elements here.
5. Bounce rate
Bounce rate shows the percentage of single-page sessions out of your total website sessions.
A high bounce rate means many users are landing on your page and leaving without further interaction.
Decrease your bounce rate by introducing ways to engage website visitors. This could be highlighting interesting content, providing better offers, or improving your funnel.
Technical issues like slow site speed can also result in visitors exiting your website. So keep an eye out for pages with suspiciously high bounce rates and test their performance using the Google PageSpeed Insights tool.
Some types of traffic are more engaged than others and therefore less likely to bounce. To bring in more valuable visitors, look for content and acquisition channels with a low bounce rate. You can then create similar pieces or target these channels.
6. Average time on page
Average time on page shows how long visitors spend on a website page.
A high average time on page suggests your content provides a good user experience that resonates with your readers. A low time on page suggests the visitor wasn’t engaged.
Dig into the time on page metrics to see individual page performance. This highlights the types of content that resonate with your audience.
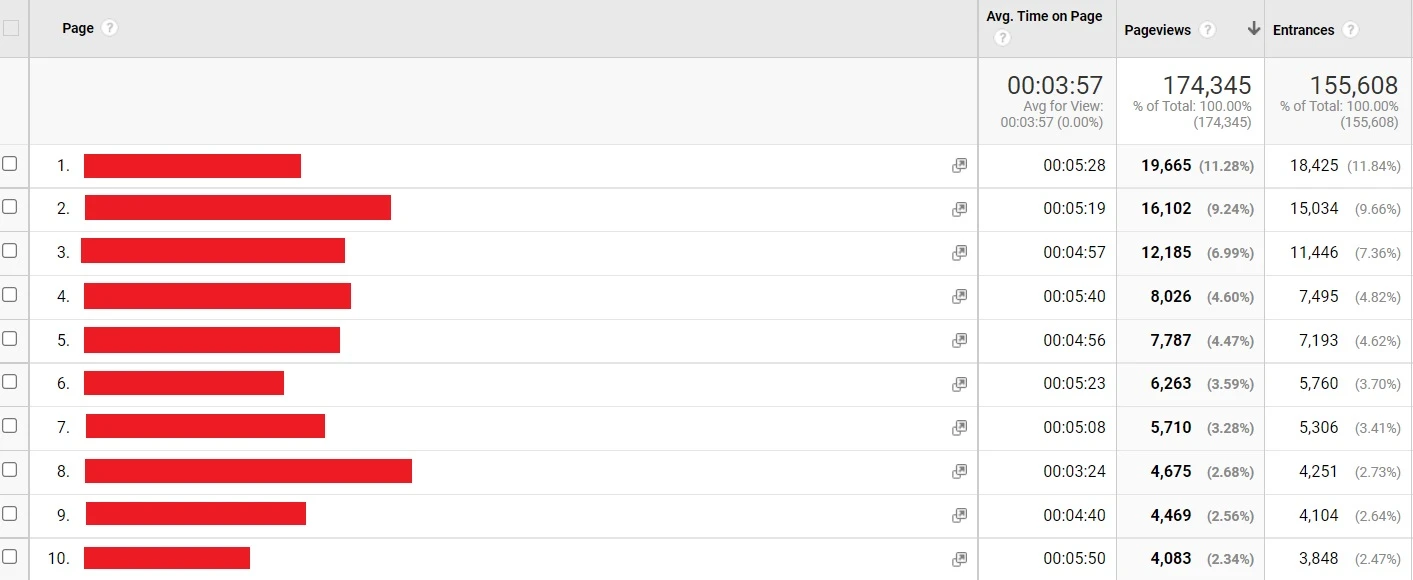
Use this information to create similar content, or use these pages as the focus of your marketing campaigns.
7. Sessions per user
Sessions per user shows the average number of times a user visits your website.
More sessions per user are great if you run an ad monetized website—you’ll earn more from each reader if they return multiple times.
Having a high number of sessions per user is also a good sign for websites that sell products. An Episerver study found that 92% of first-time visitors to a brand website do something other than make a purchase. This suggests that repeat sessions are essential if you want to make sales.
Creating great content that encourages repeat visits can increase sessions per user. MailerLite customers can easily add a blog to their website with our blog creation feature.
Building ways to reconnect with visitors can also help bring people back to your website. Consider creating an email newsletter, pointing them to your social media channels, or enabling browser alerts.
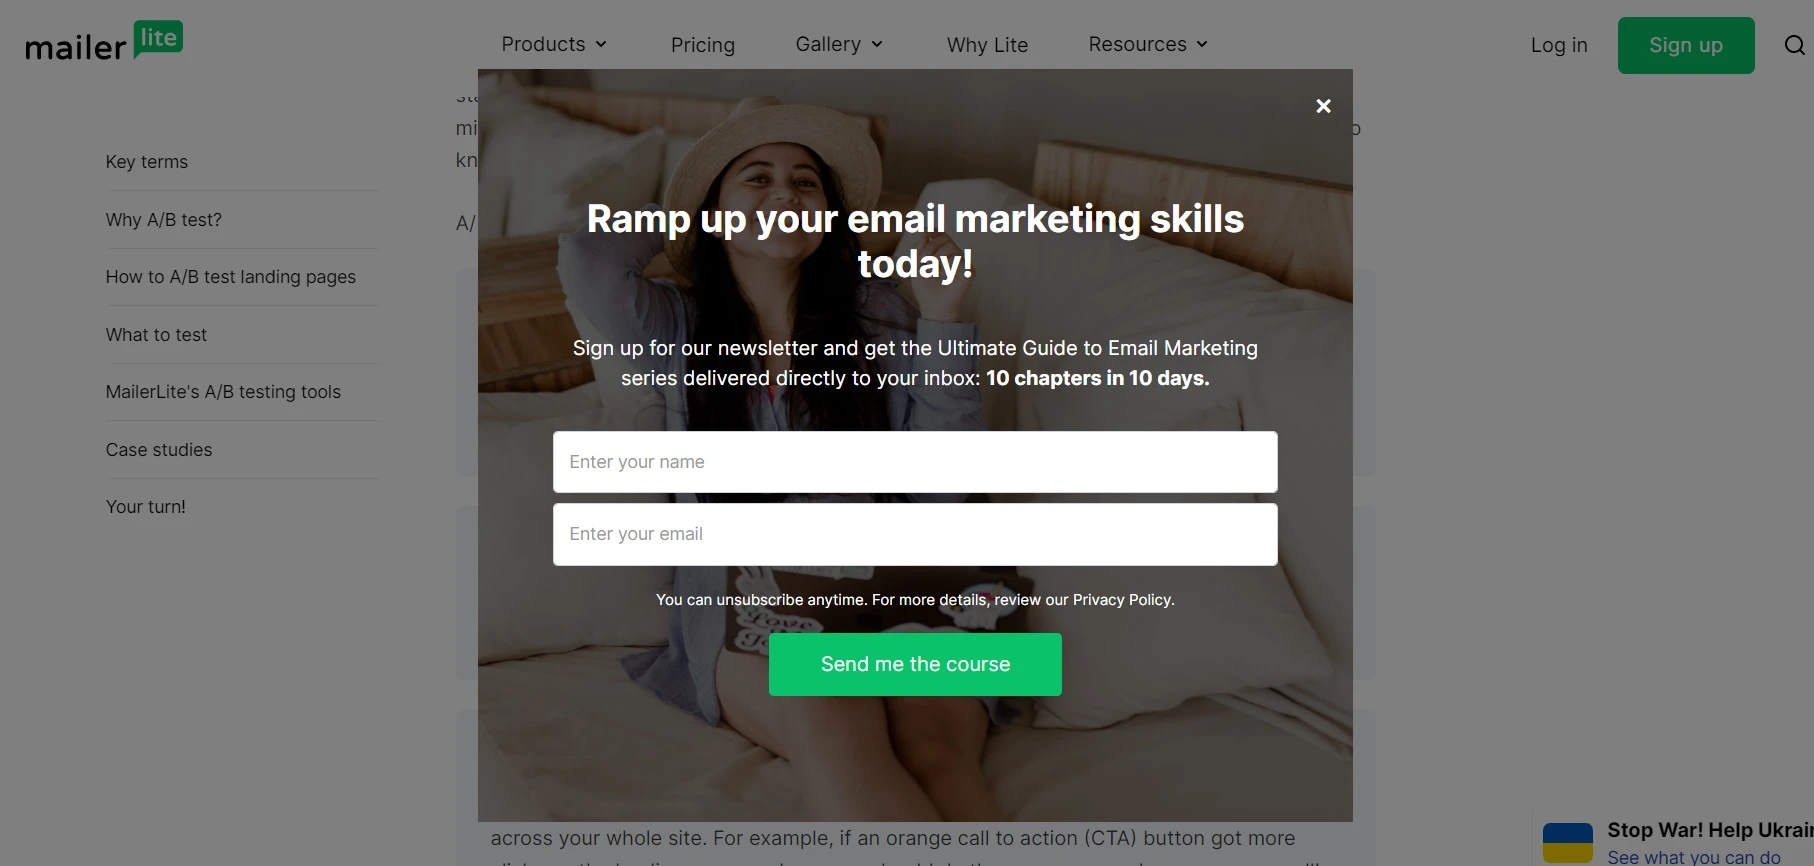
At MailerLite, we use a popup to generate newsletter signups. When people register, we send them helpful articles encouraging them to return.
Conversion KPIs
Conversion KPIs show how well your website converts visitors. Conversions could mean buying products, filling in lead generation forms, visiting sales pages, registering for a newsletter or signing up for software.
8. Goal conversions
Goal conversions are when someone performs a predefined action on your website or web page.
Knowing how pages convert is useful for many reasons. For example, you can drive traffic to high-performing pages or increase conversion on underperforming pages through strategies like landing page A/B testing, better communication of value and improving your CTAs.
There are two main ways to track conversions in Google Analytics:
Goal conversion rate: The percentage of website or page visitors that convert
Goal completions: The number of conversions on a page
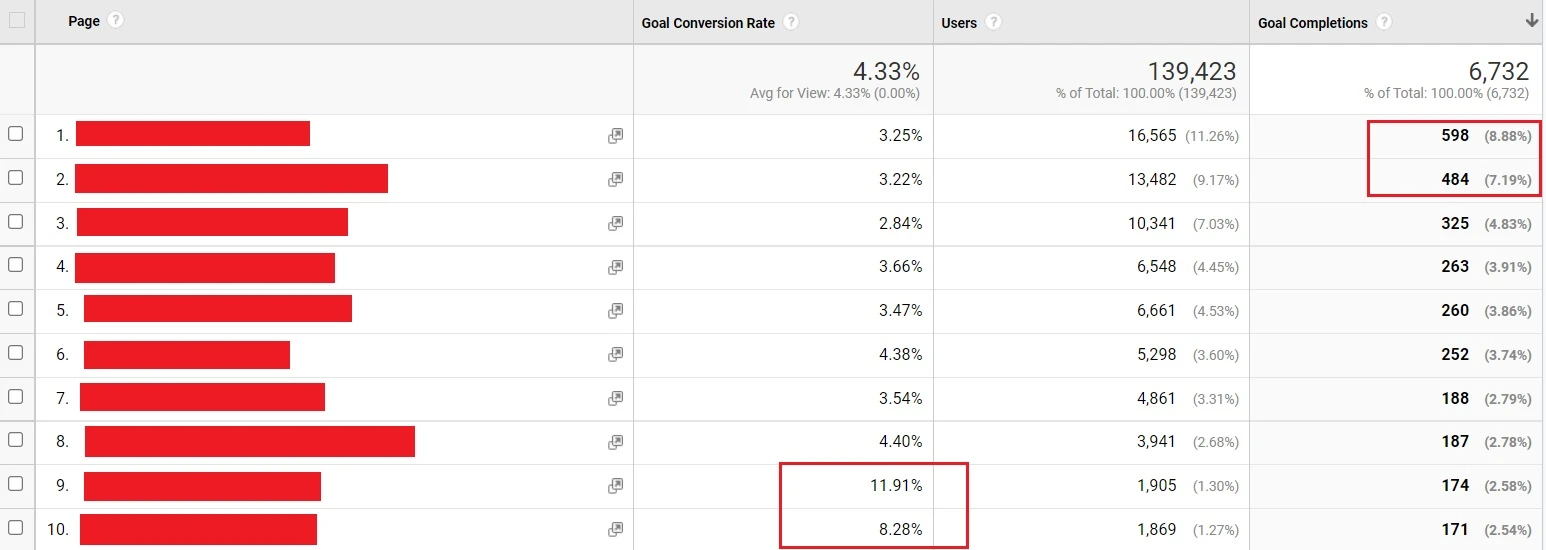
It’s useful to track both these metrics as they provide a more balanced picture of website performance.
For example, you may have a high-traffic page with a low conversion rate. But if the traffic volume is high enough, it may have more overall conversions than a lower traffic page with a higher conversion rate.
You can see an example of this in the image below.
Google Analytics lets you track pretty much any type of conversion. It doesn’t have to be the final sale or signup.
This is useful because the buyer’s journey for every successful sale consists of multiple smaller conversions.
These smaller actions in the lead-up to a sale are called micro conversions. The website’s primary goals are called macro conversions.
Here are examples of each type.
Macro conversions
Order completions
Paid subscription signups
Product demo request
Contact form completion
Micro conversions
Viewing a product page
Free trial sign-up
Watch product video
View over two pages in a session
Tracking both conversion types clarifies how your website pushes people towards taking action.
9. Goal value
Goal value is another conversion-related metric. It shows the value of the conversions that occur on a page. This is useful if your conversions have different impacts on revenue.
Imagine you have 2 goals: to watch a product video and sign up for a demonstration.
The latter goal is more valuable than the former, but your analytics won’t reflect this if you don’t assign values to each type of conversion. You’ll just see the total conversions a page generates.
Tracking the actual value of the conversions allows you to estimate the value of each page more accurately. You can then focus your sales and marketing efforts on pushing people towards the most valuable pages.
You can assign each goal an estimated value based on its importance to the sales funnel.
For example, if the average lifetime value of a customer is $1,000 and you convert around 10% of people who sign up for a product demo, you can assign each demo a value of $100. And if you know you generate one demo for every 20 product video views, you can assign a video view a value of $5.
Which website KPIs will you measure?
Hopefully, this article has provided some ideas about the types of web KPIs you can measure. Before committing to any of them, just remember to follow these steps:
Decide what you want your website to achieve
Look at the website behaviors that lead to these goals
Discover KPIs that show these behaviors
You can then begin to track these KPIs to see how your site performs and the impact of your optimization efforts.