Email marketing reporting: Stop guessing and see what works
 Ernesta, Legal, and Bob, SRE
If you want to improve your email marketing campaigns, you need to know how people react to the content you’re already sending. Email marketing reporting helps by tracking the impact of your messages, so you can make changes that push the needle forward.
In this article, we’ll dive deeper into email marketing reporting, including why you should do it, what to track, and how to build an effective dashboard with easy-to-use tools.
Email marketing reporting shows changes over time
Email marketing reporting is a process for collecting and analyzing the data from your campaigns. It works because, rather than focusing on one-off metrics, it gives you an understanding of how your sending results change over time.
Reporting typically involves defining your goals and then setting up dashboards to help you track the most relevant metrics. You can then use the insights you gain to improve your campaigns.
Reporting gives deeper insight into what works
While we’ve all looked at individual metrics from a campaign, creating a regular reporting process takes your analysis up a level. Here are the biggest benefits of reporting:
You’ll know which content types, offers and messaging work. You’ll also see which of your subscriber groups is the most valuable
Once you know what works, you can focus on these factors. You’ll start to see better results from your campaigns as you’ll be taking steps that are proven by data
You’ll also become better at time management since you’ll be laser-focused on the things that bring results rather than less important tasks that don’t move the needle
Reporting also makes it easy to share your results externally. Set up dashboards that highlight your results and then send these to relevant people, whether that’s your boss, clients, or others in your team
All these factors ultimately help you send more impactful email marketing.
The core metrics to include in your email reports
Choosing what to track is key to effective email marketing reporting. There are tons of metrics you can follow, but it probably doesn’t make sense to track them all.
Instead, define your goals first and then choose the specific metrics that push you towards them
We’ve listed the most important metrics below. To read about them in more detail and get tips to improve, read our article on email marketing metrics.
Email engagement metrics
Engagement metrics show how people interact with your email content. They can show whether the people on your list enjoy your emails, and the specific types of content they enjoy.
Some of the most common email engagement metrics are:
Open rate: The percentage of email recipients who open the email
Click-through rate: The percentage of email recipients who click on the email
Click-to-open rate: The percentage of openers who also click on the email
Opens and clicks: The total number of people who open or click on an email
Link clicks: The actual links that people click on
It’s worth noting that open rate and click-to-open rate data are inaccurate since Apple Mail marks all emails it receives as open. But it can still be helpful to track changes to these metrics over time, as the amount the metric is off by will stay consistent.
Alternatively, focus on click-through rate, since that isn’t impacted by opens.
To add context to your reports, it can help to consider industry benchmarks. Our benchmarks report helps by showing you the median metrics across all campaigns.
Here’s a look at the data for 2025.
Benchmark open rate: 43.46%
Benchmark click rate: 2.09%
Benchmark click-to-open rate: 6.81%
You can read the full email marketing benchmarks report for more details, including the median metrics broken down by industries and regions.
E-commerce metrics
E-commerce metrics show the impact of your campaigns on your sales. If you promote products in your emails, these are likely to be the most important metrics for you to include in your reports.
Orders: The number of orders generated by an email campaign
Revenue: The total revenue generated by an email campaign
Average order value: The average value of an order generated by the email
Conversion rate: The percentage of people who go on to buy
Orders are tracked on MailerLite using a 30-day last click attribution method. This means that an order is attributed to an email if someone clicks on an email and then hits purchase within 30-days. The purchase is always attributed to the most recent email that they clicked on.
You can track these metrics by either using MailerLite’s features to create a digital product or service, or by connecting MailerLite to your e-commerce store.
Deliverability metrics
Deliverability metrics show the ability of your campaigns to reach the inbox. This is essential to ensure that your emails result in engagement and sales.
Important deliverability metrics include:
Unsubscribe rate: The percentage of people who unsubscribe from your email list
Spam complaints: The number of people who mark the campaign as spam
Bounces: The number of sent emails that can’t be delivered
Deliveries: The number of emails delivered
If you send emails at scale, you’ll have a small number of unsubscribers, spam complaints and bounces, even if you do everything right. But a sudden increase can indicate issues with your domain, IP, or the way you collect subscribers.
Check out this article for more on how to keep your email deliverability sky high.
If your spam complaint rate goes too high, inbox provider will start sending your messages to the spam folder. Gmail and Yahoo say you should ensure your spam complaint rate never goes over 0.3%; while Gmail also recommends that you keep it under 0.1%.
List growth metrics
List growth metrics show how your subscriber base changes over time. While engagement and deliverability metrics tell you how your existing subscribers respond to your emails, list growth metrics show the impact of your subscriber acquisition methods.
The most important list growth metrics are:
New subscribers: The number of people who join your list in a given period
Unsubscribe rate: The percentage of recipients who opt out after a campaign or in a given period
Net list growth: The number of new subscribers minus unsubscribes and bounces
List growth rate: The percentage rate at which your list is growing over a set period
Subscriber source: Where your new subscribers are coming from, such as a signup form, landing page, or paid campaign
In MailerLite, you can track list growth in the Subscribers section of the Performance Overview dashboard.
It shows total active subscribers, new subscribers today, new subscribers this month, and unsubscribes over the last 30 days, along with a chart showing how your list changes over time. This is one of our many built-in email marketing analytics dashboards.

Automation metrics
While campaign reporting shows how individual emails perform, automation reporting helps you understand how your automated email sequences, like welcome series or post-purchase flows, perform over time.
The key metrics to track are:
Completion rate: The percentage of subscribers who complete the full sequence
Step-by-step open and click rates: Where engagement drops off in a flow
Revenue per sequence: The total sales attributed to an automated flow
Because email automations run continuously, small improvements at each step compound over time. A drop-off at step two of a welcome sequence, for example, means every subscriber who joins your list is hitting the same problem; fixing it has an outsized impact compared to improving a one-off campaign.
In MailerLite, you can view the overall performance data for each automation in the automation overview. You can dive deep into each email to see the impact of each automation step in either the overview or directly inside the automation editor.
How to create an email marketing reporting dashboard
Now you have a better idea about the types of things you can track, here’s a look at how to start the process.
The easiest way is with a reporting dashboard, since having a dedicated place to track your chosen metrics means you can get all the info you need at a glance without having to dig through the data every time you need some insight.
1. Define your goal and your KPIs
The first step is to define the goal of your report and the KPIs that highlight if you're going in the right direction.
These could be factors like your email engagement over time, or the number of sales brought by different campaigns.
Avoid adding too much to a dashboard, even if you have multiple goals. Instead, keep things clear by creating multiple reports for each specific use case.
2. Build your dashboard

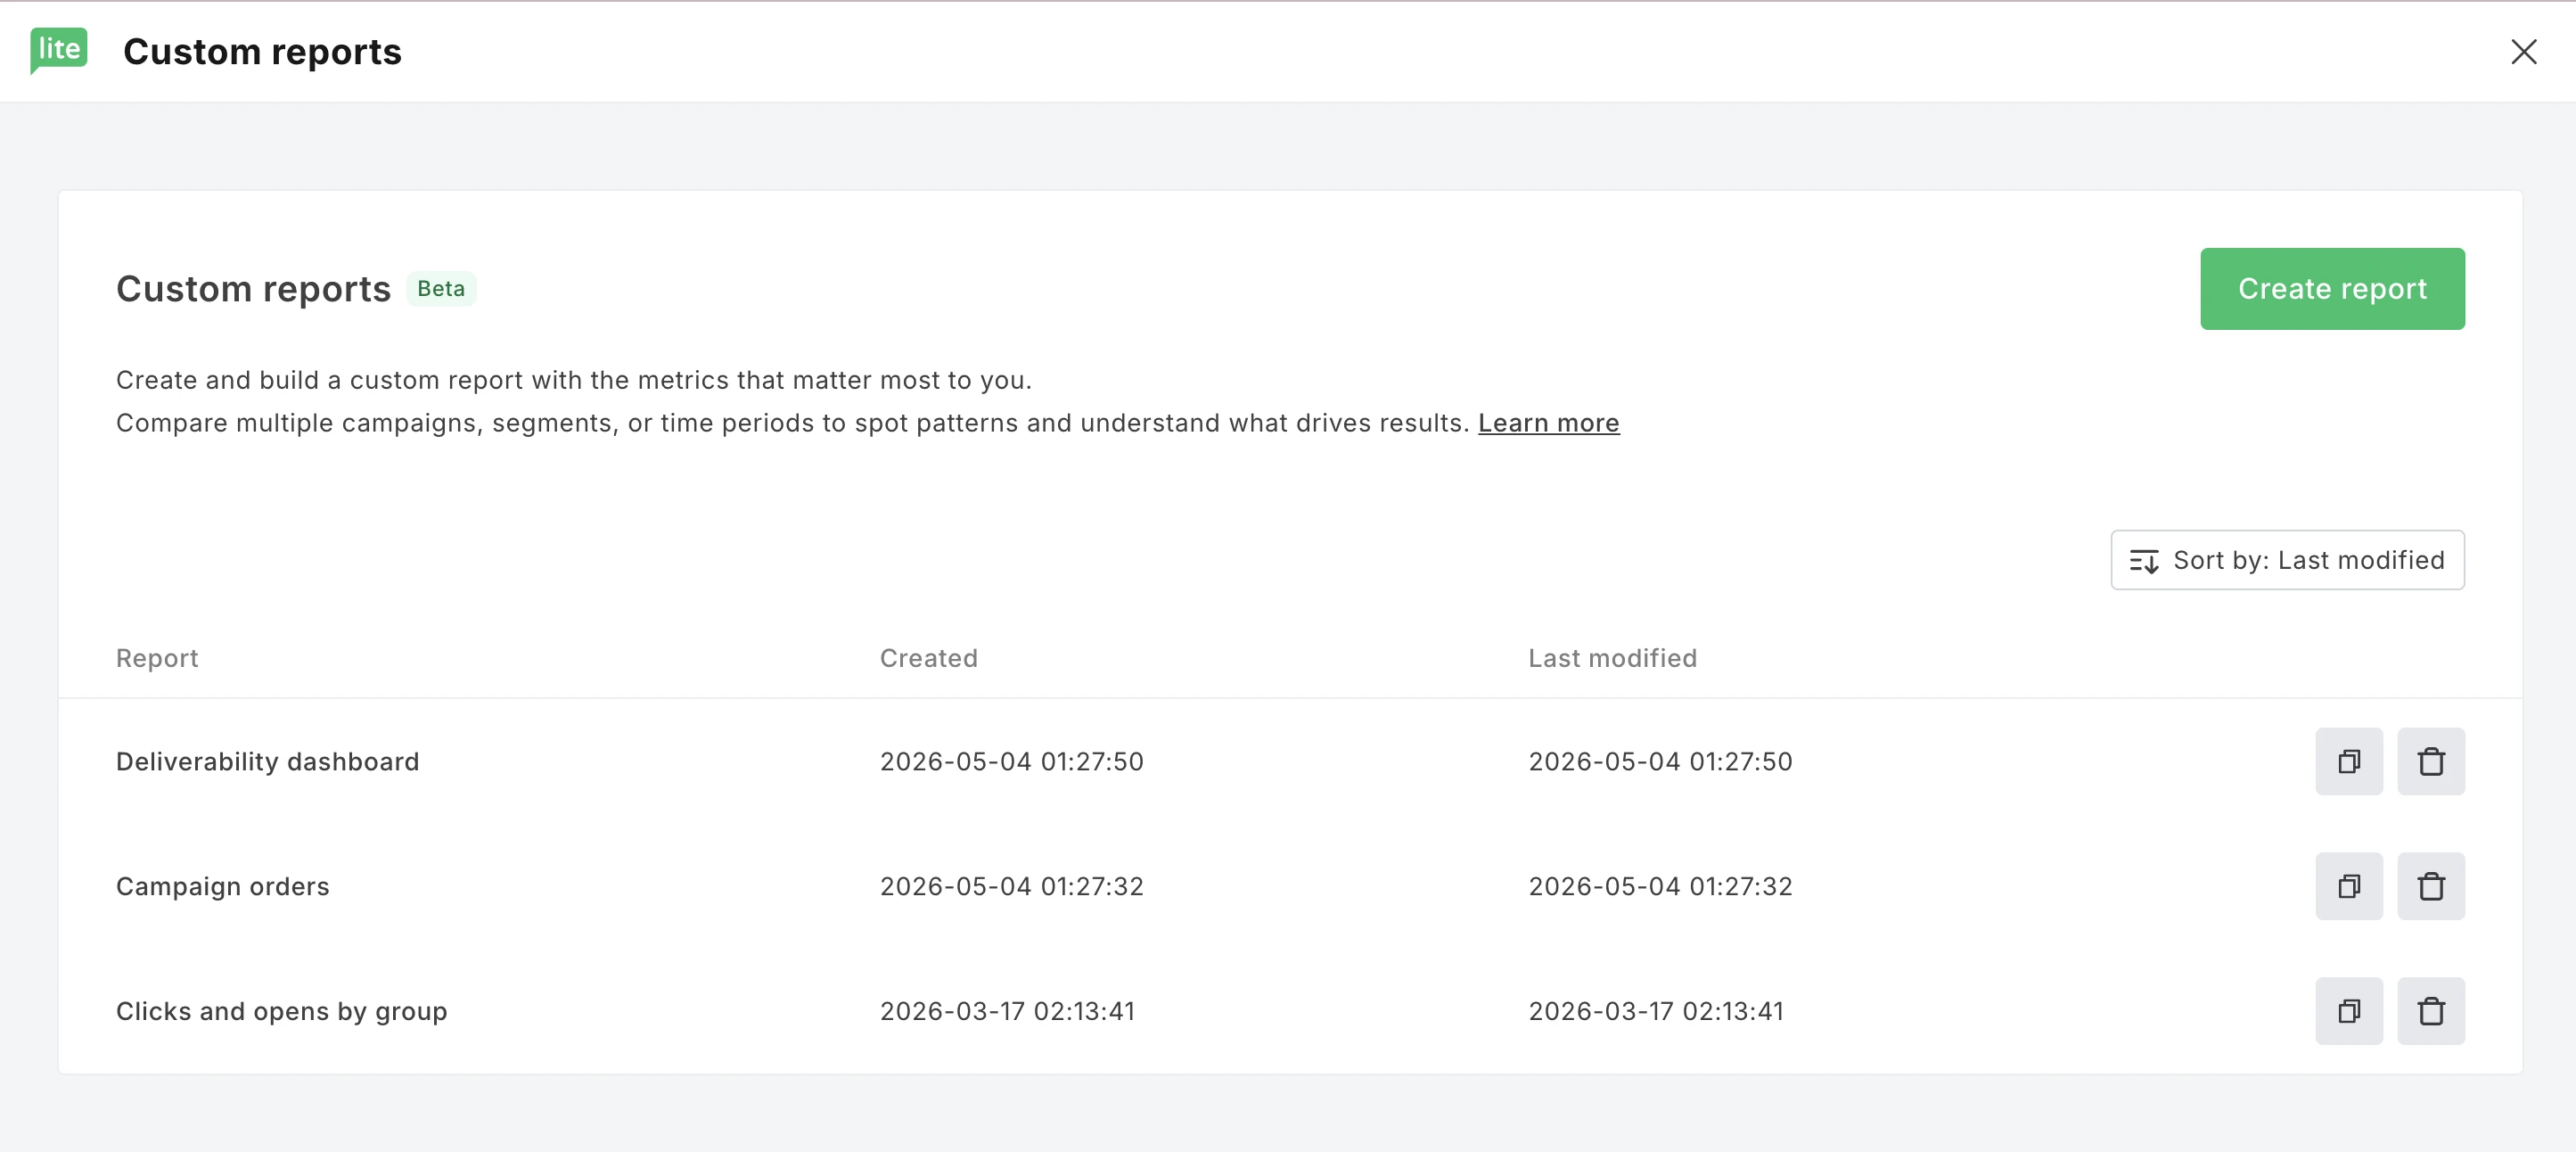
Next, you need to build your dashboard. MailerLite has custom reporting features that make this super simple.
Just follow these steps:
Click the Custom reports option in the Campaigns dashboard.
Give your report a name.
Select the metrics you want to track.
Choose whether to group the dashboard by campaign, time period, or subscriber group.
Add any relevant filters.
Choose the time period you want to see data for.
Hit Save.
That’s how to create a report in MailerLite, but you have other options for reporting tools you can use. We go into further detail on your different options later in this article.
2. Review the numbers and build a reporting routine
Once you have some data, check your report to see how it progresses. It’s best if you define a routine that you use to check reports.
For example, you may:
View your deliverability metrics after every send
Check your list growth numbers every week
Send campaign reports to clients every month
The point is to build a routine where you regularly check the metrics at intervals that allow you to see what is working and take steps to improve things, without becoming overwhelmed with data.
If you need to share your metrics externally with clients or your boss, this is the stage where you can either share the report directly or export the data. MailerLite’s custom reports feature lets you download the data in a click as either a CSV file or a PDF for visual sharing.
3. Act on the insights
Then comes the most important step: acting on the insights you have gained from your reporting.
Look for the factors that work well, such as content types that get engagement, offers that bring in sales, and subscriber groups with high interaction, and apply these learnings to your other content.
Additionally, if you spot issues, such as an increase in spam reports or bounces, start investigating what could be causing the problems.
4. And repeat
Reporting is an ongoing process. Once the report is set up, you can keep reviewing the numbers, making changes where relevant, and then repeating the process to continually boost the impact of your email marketing.
Example email marketing reports you can create today
Here’s a look at 4 different email marketing reports you can create to highlight different aspects of your campaign. We’ve included screenshots of dashboards built with the MailerLite custom reports feature.
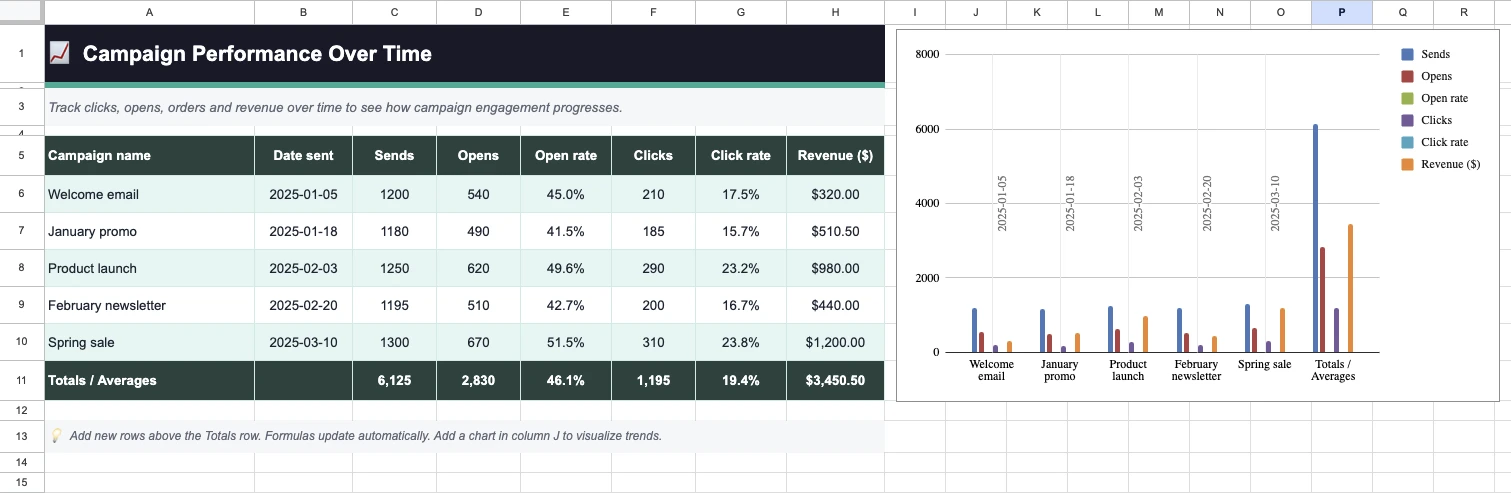
1. Campaign engagement over time
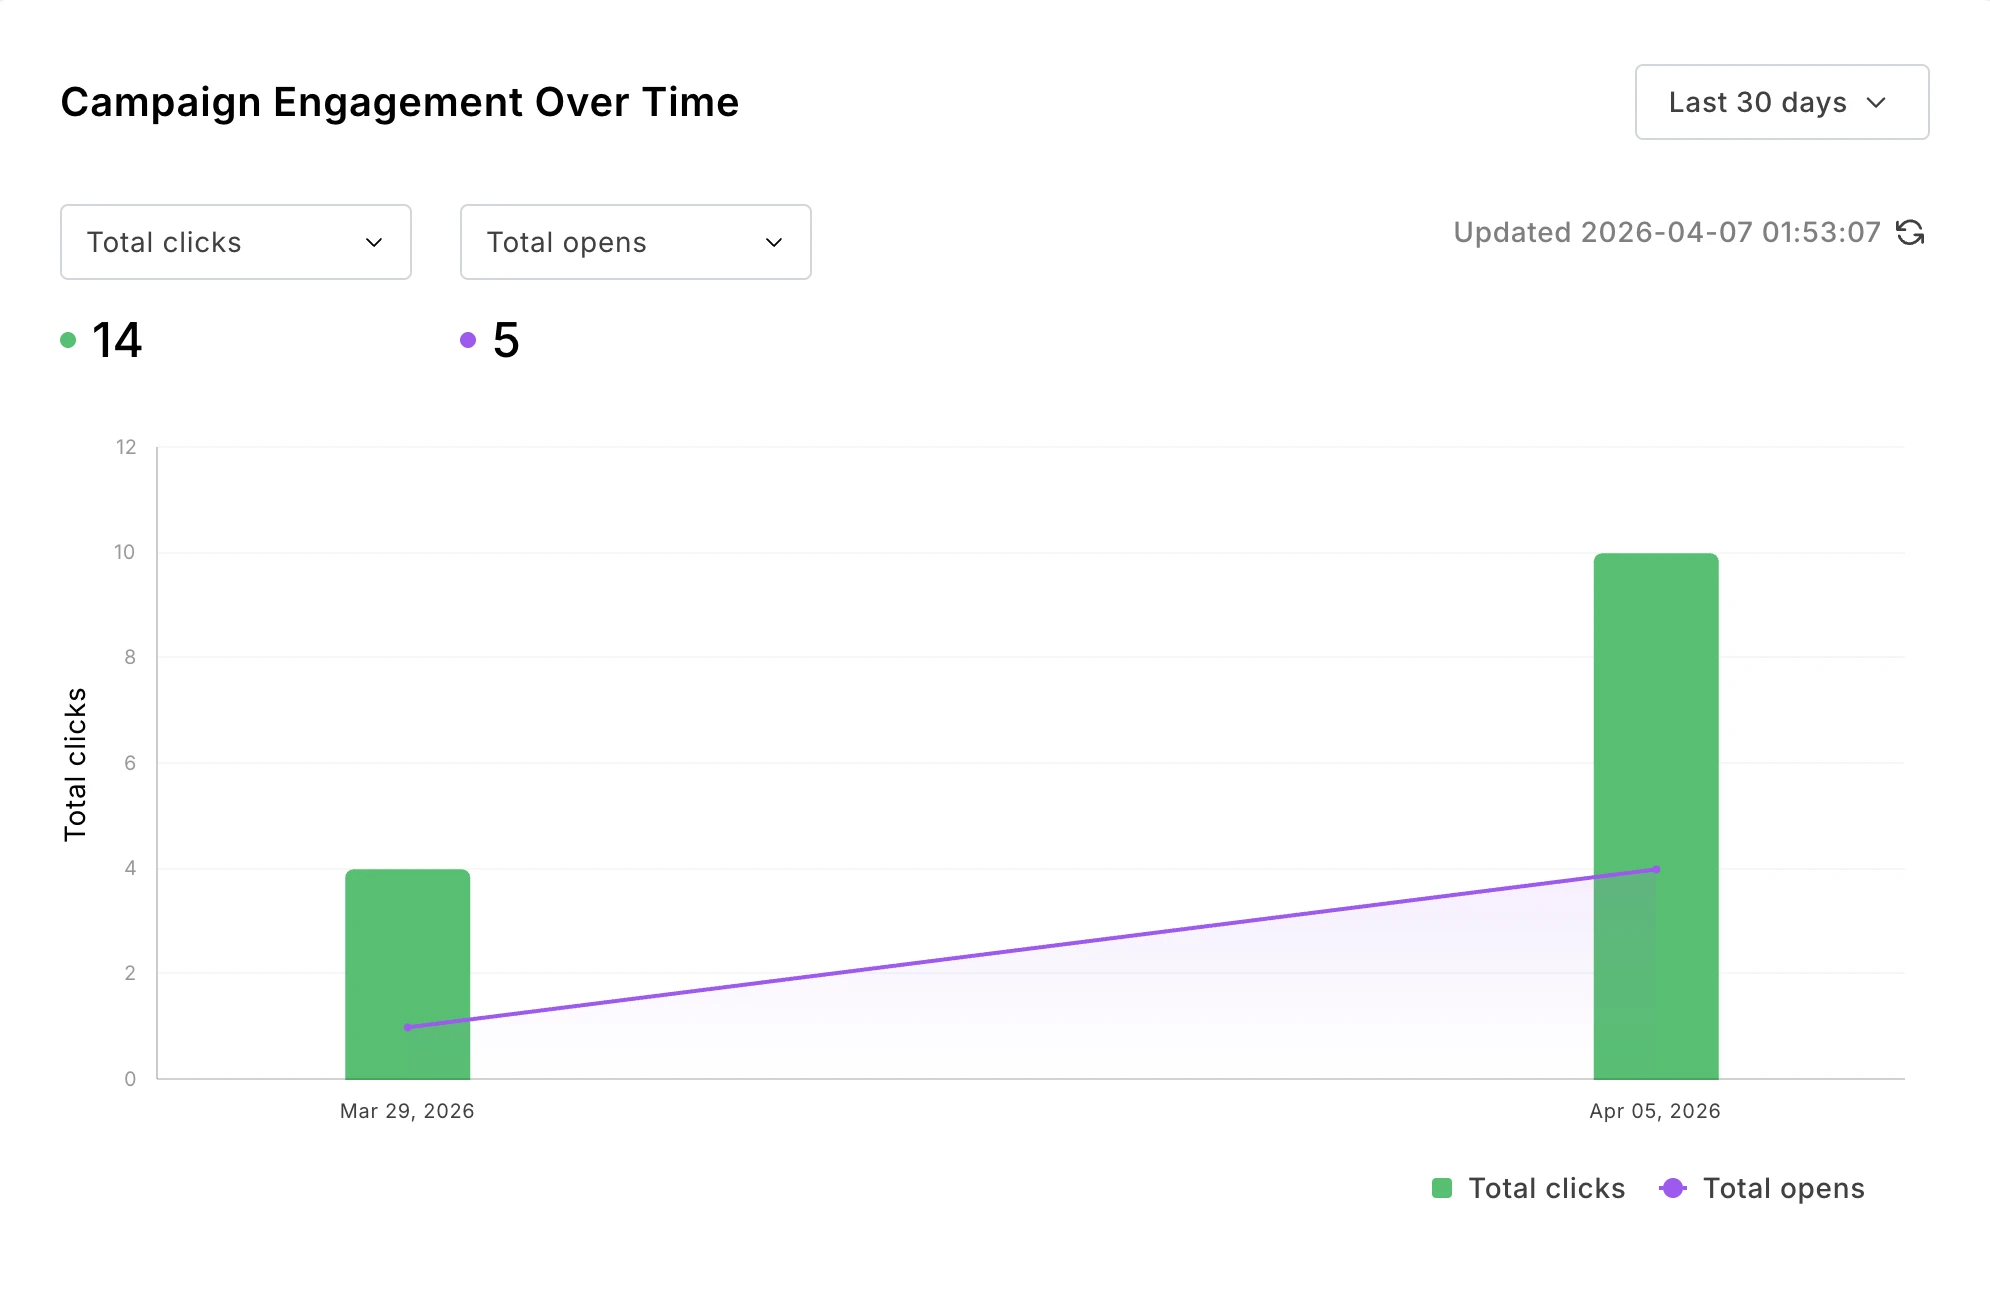
Track clicks, opens, orders and revenue over time to see how campaign engagement progresses.
Name: Campaign engagement over time
Metrics: Open rate, click rate, total opens, total clicks, etc.
Group by: Day, week or month
Filter by: n/a
2. Engagement by subscriber groups
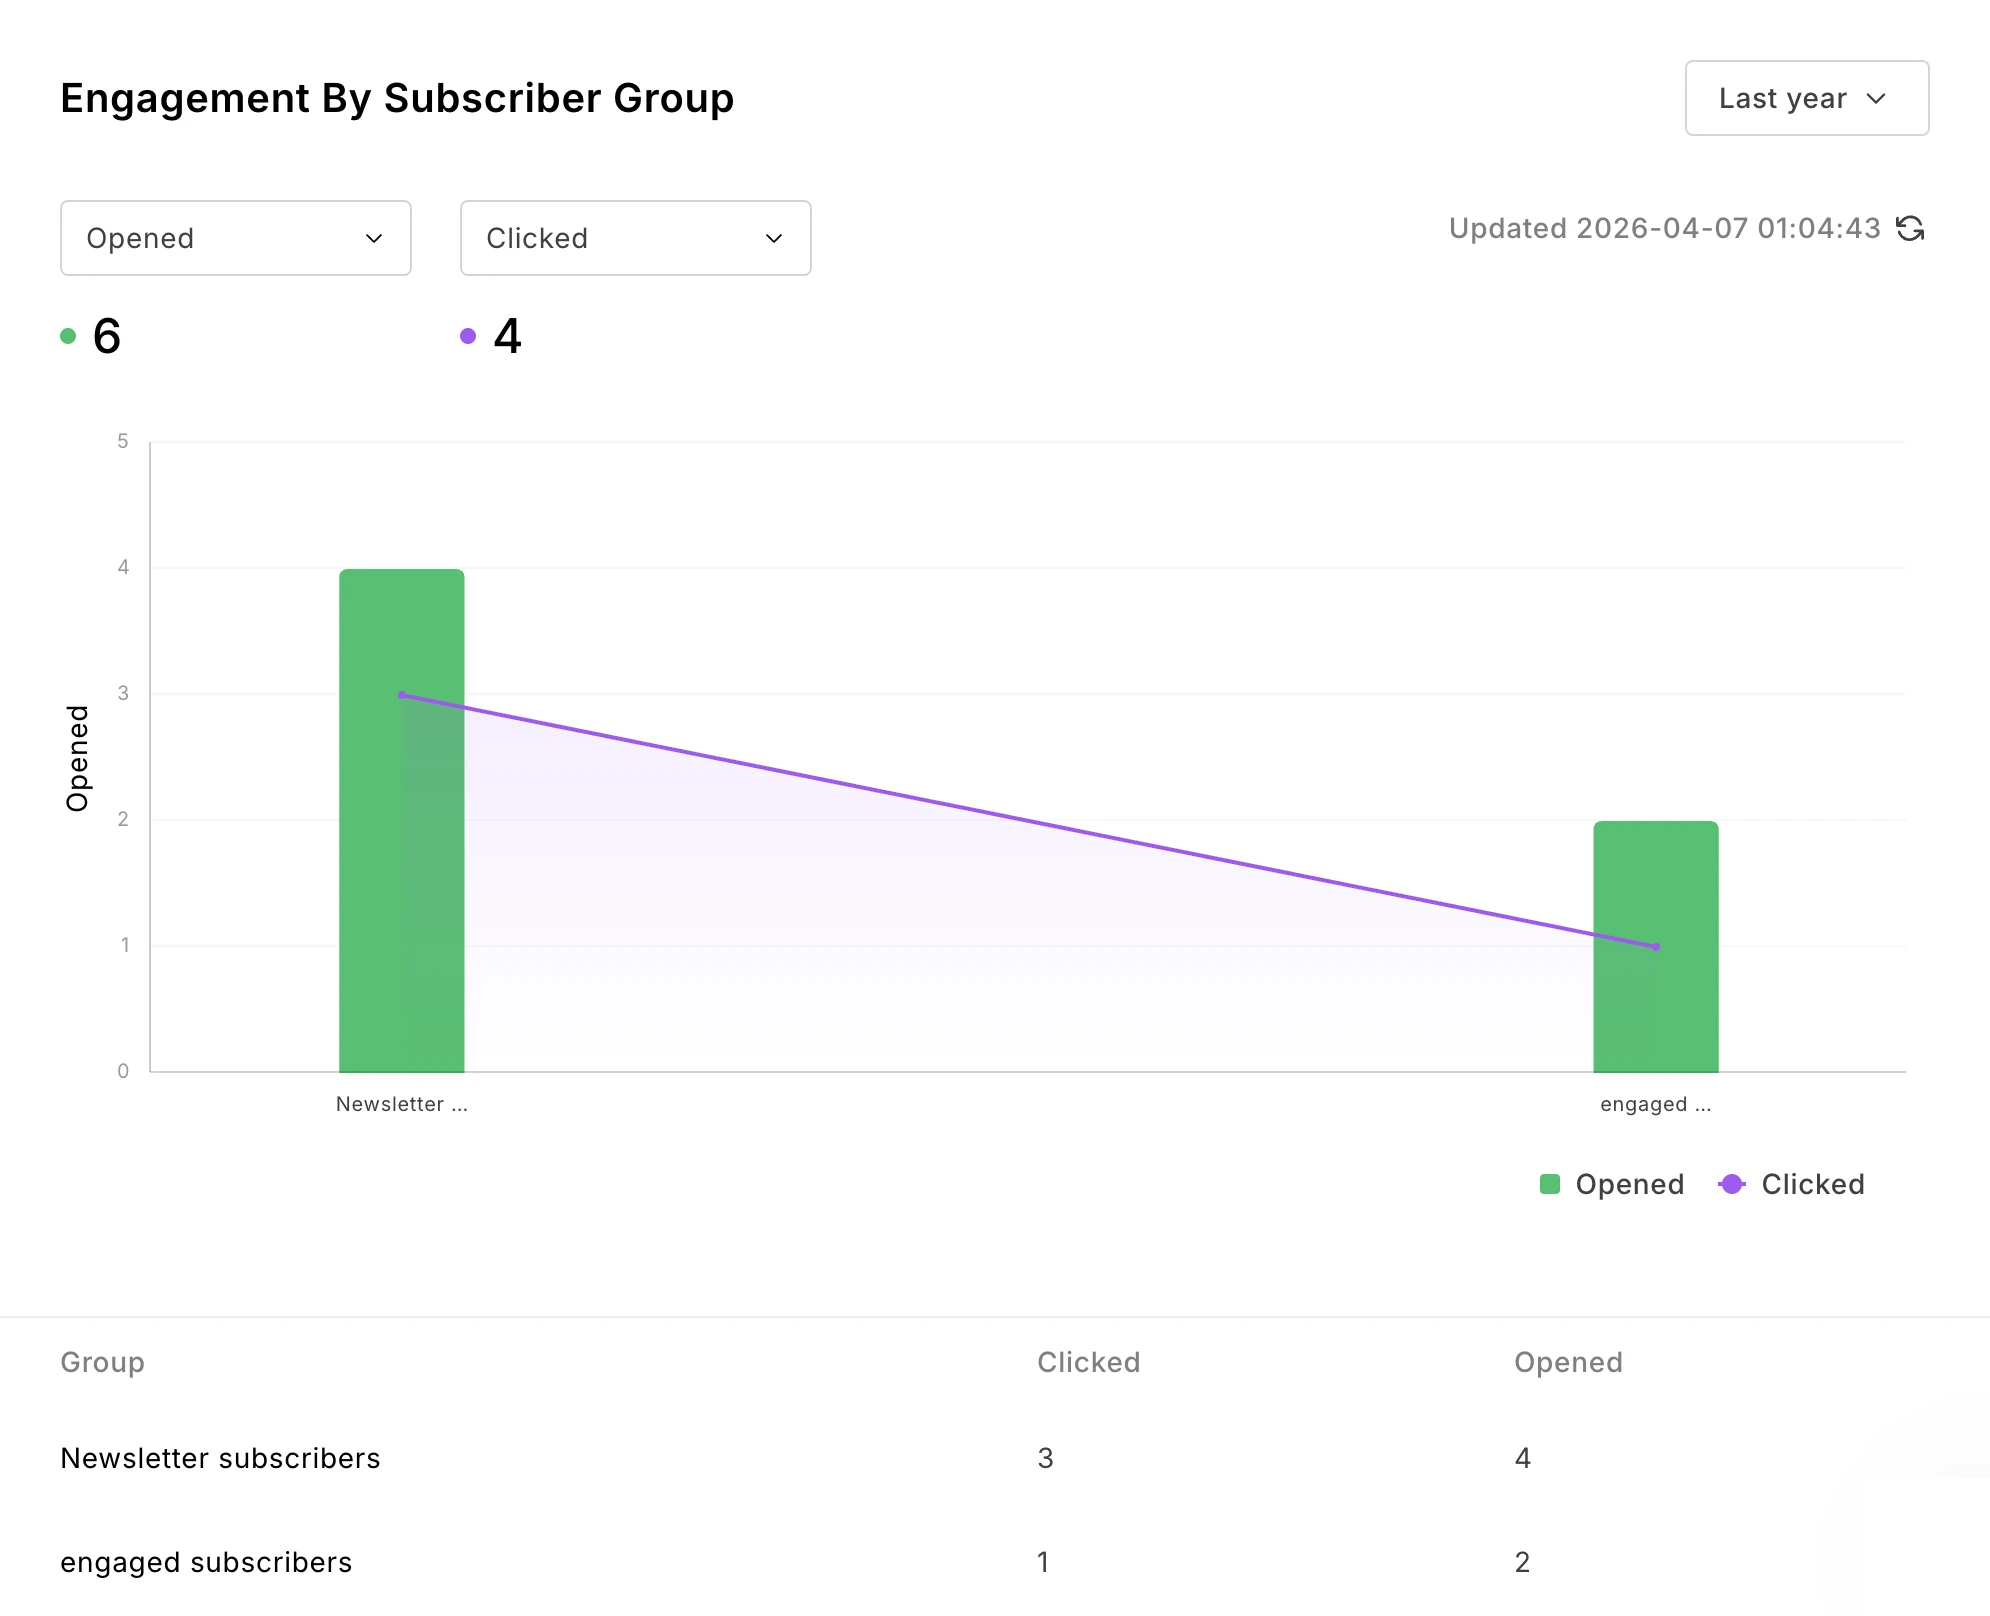
Track which subscriber groups are the most engaged with your campaigns. Perhaps people who join via a particular lead magnet are most likely to make sales. Or maybe subscribers from paid ads are the most engaged.
Name: Engagement by subscriber group
Metrics: Open rate, click rate, total opens, total clicks, etc.
Group by: Groups
Filter by: n/a
3. Orders or engagement by content type
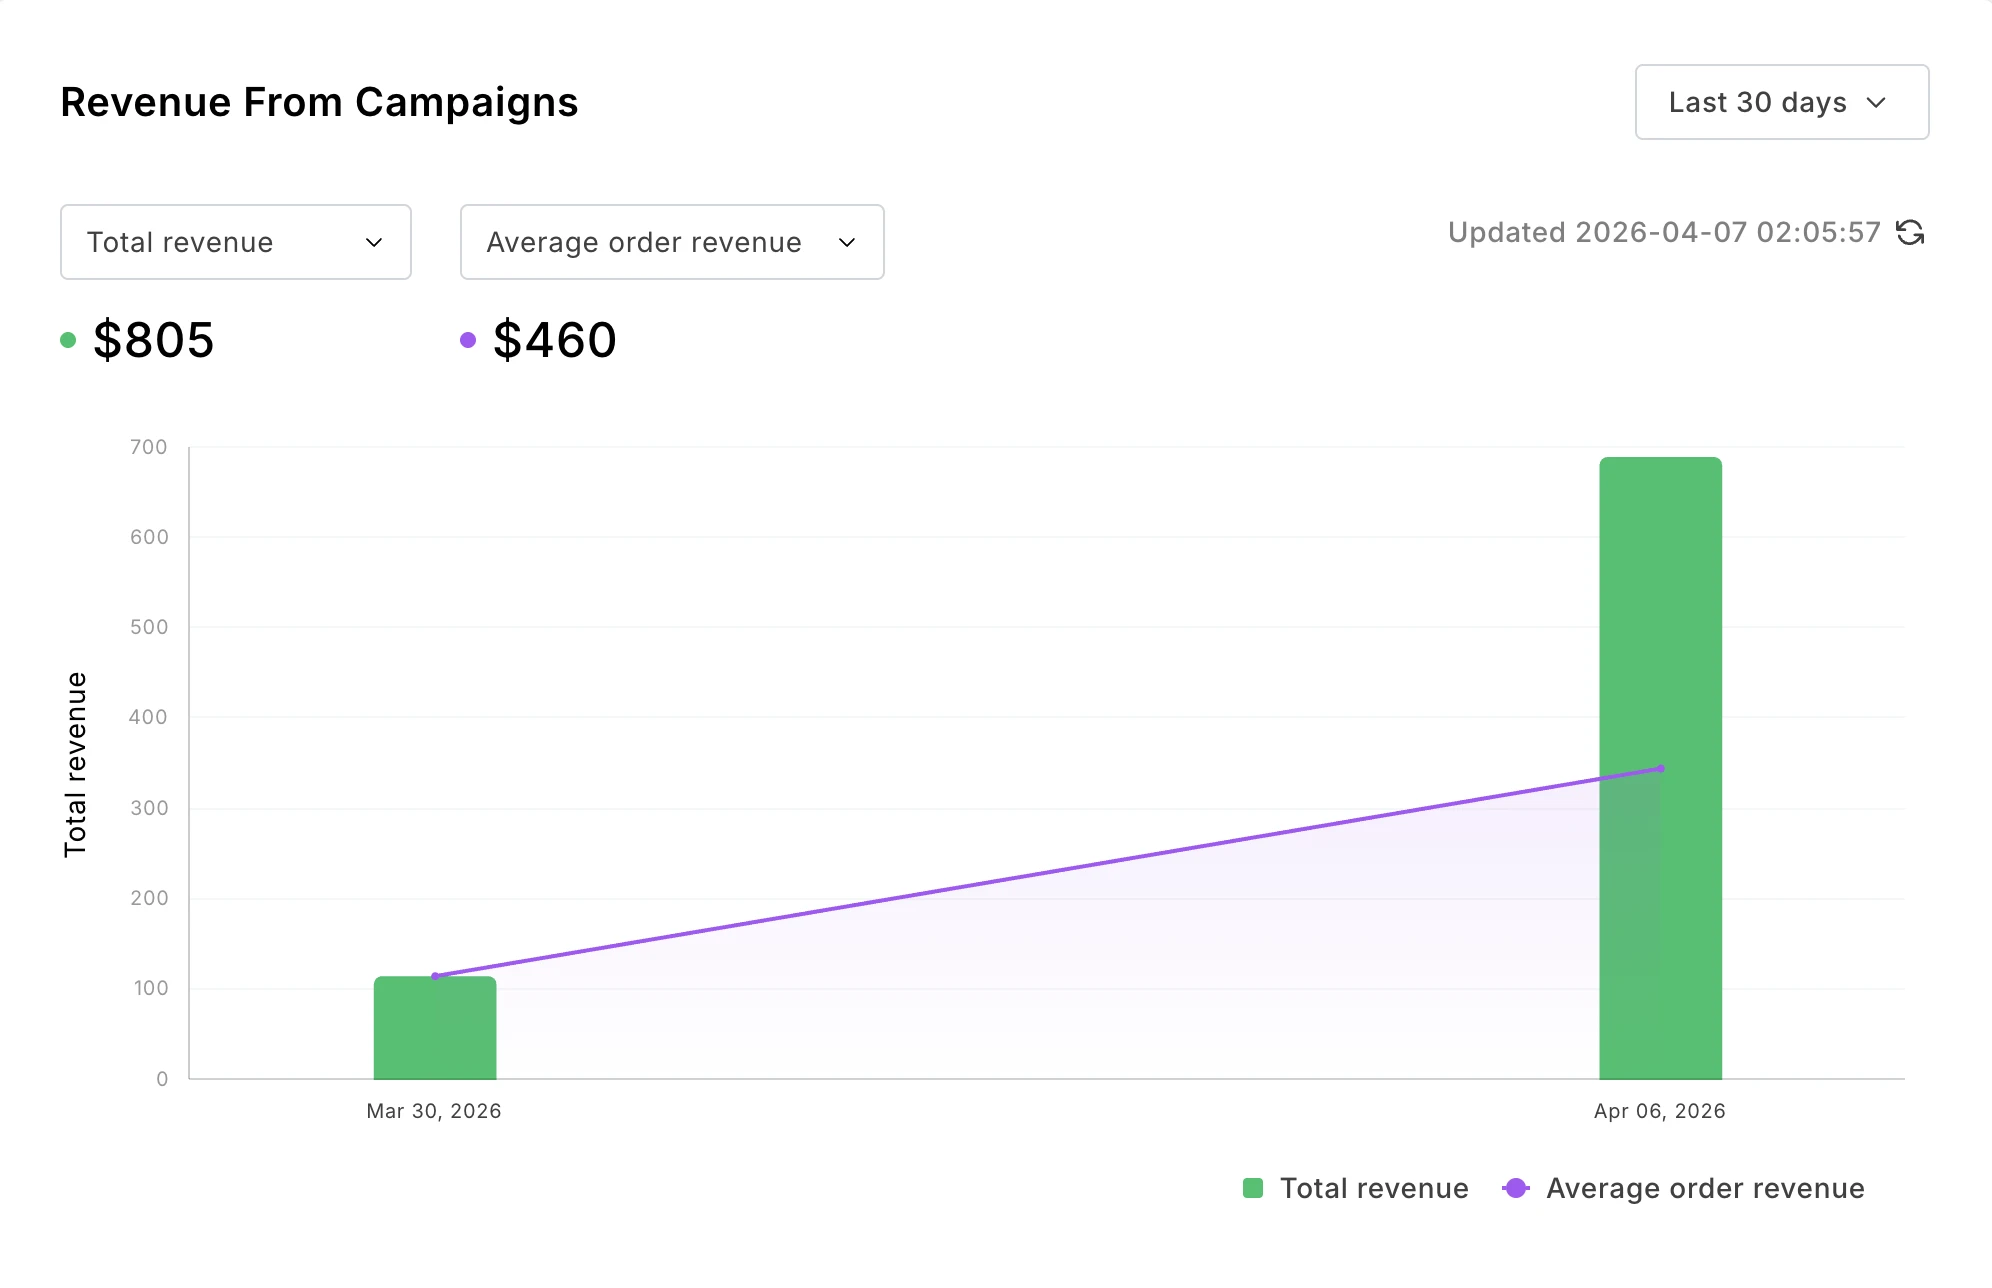
Learn what kind of content actually leads people to hit buy. See exactly which campaigns lead people to purchase from you so you can get more sales from your emails.
Name: Revenue from campaigns
Metrics: Total revenue, total orders, average order revenue, conversion rate
Group by: Campaign
Filter by: n/a
4. Deliverability dashboard
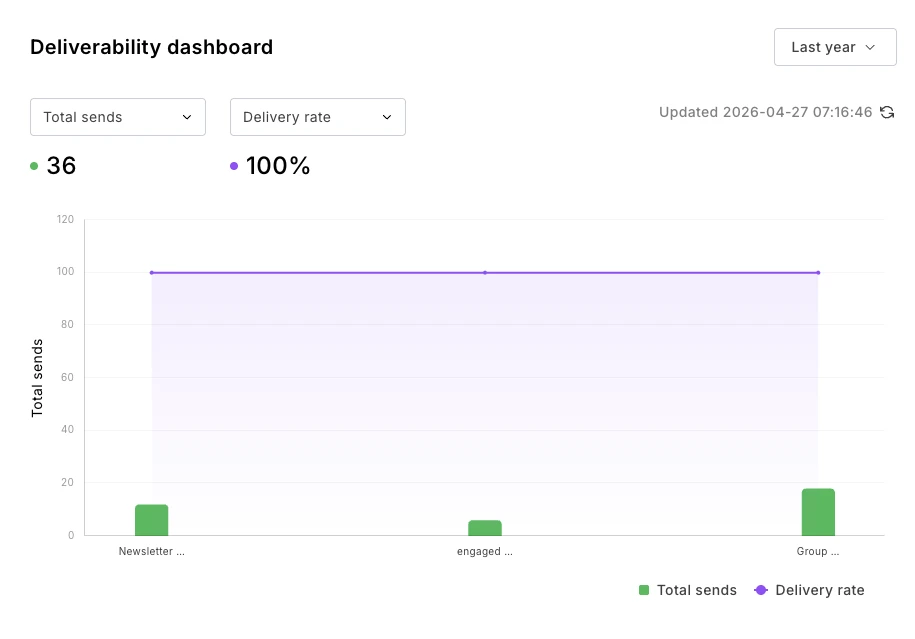
Create your own deliverability dashboard that tracks exactly how effective your emails are at landing in the inbox. Since reports update in real time, you’ll see issues as soon as they occur.
Name: Deliverability dashboard
Metrics: Total sends, delivery rate, unsubscribed, spam complaints, etc.
Group by: Campaign
Filter by: n/a
The best email marketing reporting tools
There are plenty of ways to create email marketing reports. Here’s a look at some of the best tools you can use.
MailerLite’s custom reporting tool
MailerLite has a built-in custom reports tool that lets you create visual reports in minutes by choosing the metrics you want to follow, and then how you want to group them, whether that’s by time, subscriber group, or campaign.
It’s the easiest way to turn your email marketing data into clear reports that show you what works if you’re a MailerLite customer.
Plus, you can create multiple reports for different use cases, and then share them externally by either exporting the data as a CSV for further analysis or as a visual PDF file.
MailerLite’s MCP server
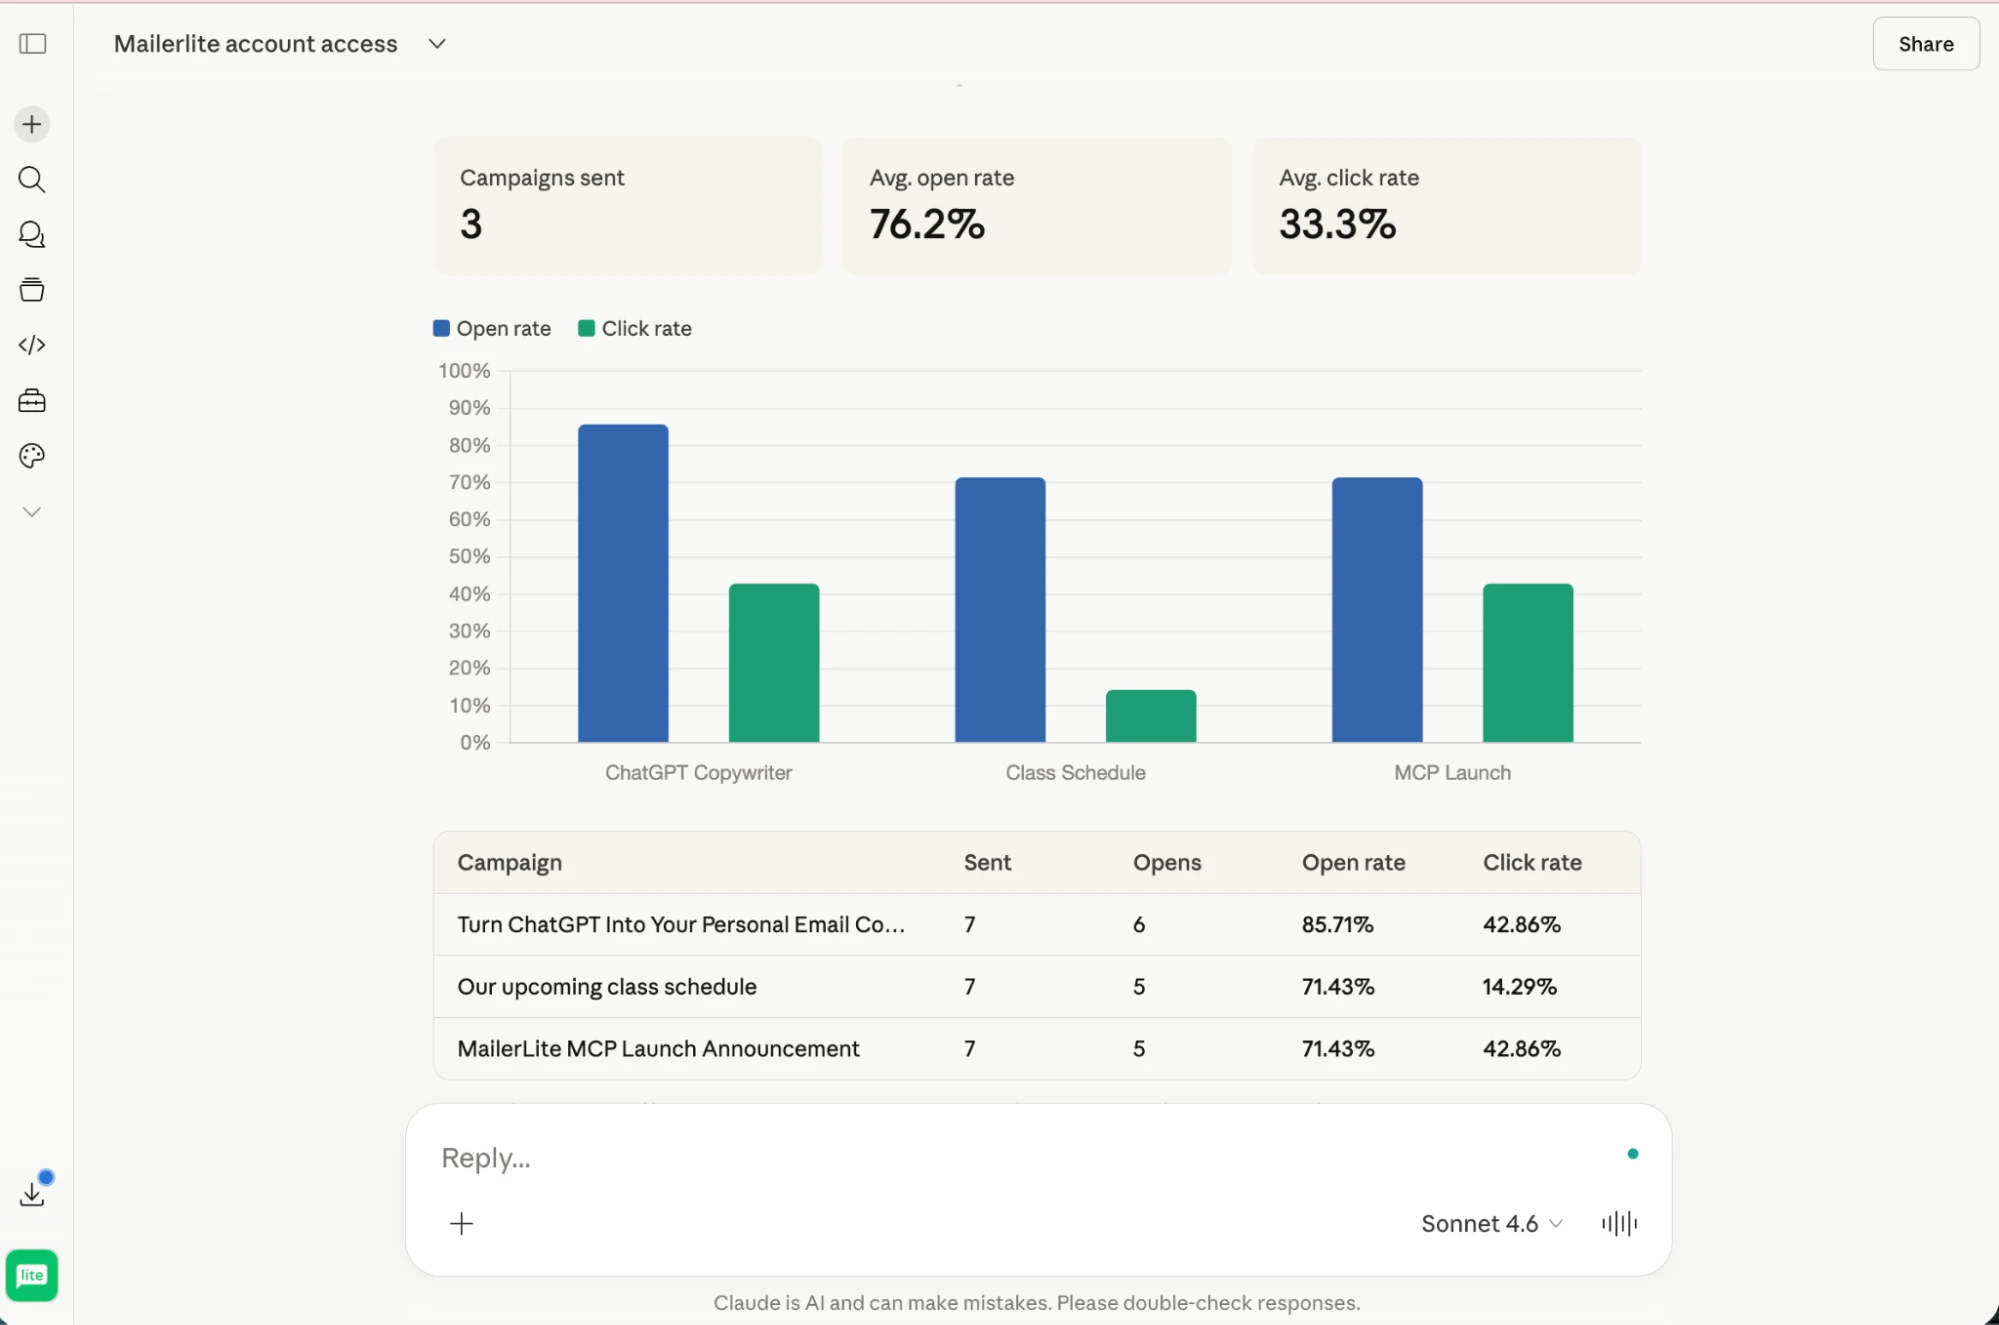
You can also use MailerLite’s MCP server to connect AI tools like Claude and ChatGPT to your MailerLite account and then ask the tool to analyse your data and create reports with the specific information you need.
While the other tools on our list can showcase the data visually, the MCP server can go further by delivering actionable steps you can take to improve.
You can also connect other marketing tools that have an MCP server and bring in data from each one to add to the report.
Spreadsheet software
A simple option that’s easy to share is to create your reports in spreadsheet software like Google Sheets or Excel.
Just create tables for the data you want to track and then use Google Sheets’ built-in design and charts features to add visual reports.
The process of creating spreadsheets is more time-consuming than simply creating the reports in MailerLite, and of course, you’ll need to manually update the data after every reporting period.
But it can be useful if you use an email marketing tool without custom reporting or if you want to show data from various sources in a single report, but don’t want to go through the steps of signing up for dedicated reporting software.
Dedicated reporting tools
Dedicated tools like Looker Studio and Tableau can help you create reporting dashboards from a variety of data sources.
This is useful if your email marketing tool doesn’t have the reporting features you need, or if you want to show email marketing data alongside data from another source.
To set it up, you’ll need to sign up for one of these tools and then use a third-party connection tool like Coupler.io to automatically bring the data from your email marketing platform into your chosen dashboard tool.
Start reporting and improve your email marketing
Email marketing reporting turns raw data into decisions. By tracking the right metrics, building a regular reporting routine, and acting on what you find, you'll steadily improve your results with every send.
The good news is you don't need to track everything, just the metrics that matter to your goals. Start with a simple dashboard, build the habit of reviewing it regularly, and expand from there as your needs grow.
If you're a MailerLite user, the custom reports feature, Performance Overview dashboard, and MCP server give you everything you need to get started. Set up your first report today and see what your data has been trying to tell you.
Try MailerLite free today
Start your free MailerLite trial to get all the features you need to build email marketing reports. Plus, get leading email design, automation, subscriber management, and e-commerce tools.
Email marketing reporting FAQs
Here are some final questions to consider when creating email marketing reports.
What metrics should I include in an email marketing report?
This depends entirely on what your report is for. If you want to track engagement, include metrics like open and click rate; if you want to track deliverability, include metrics like spam reports and bounces; and if you want to track e-commerce impact, include metrics like orders and revenue.
What is a good open rate for email marketing?
Our email marketing benchmarks report found that the median email marketing open rate for analyzed accounts is 43.46%, although this varied widely by industry, from 30% in travel and transportation to 56% in religion. Check out our article on how to increase email open rates to learn how to increase the number of people who hit open.
How do I track email campaign performance?
MailerLite users have 3 options for tracking campaign performance. First is to use the reports and dashboards built into our platform. These highlight metrics relevant to the feature you're looking at.
Another option is to use our custom reporting feature to create dashboards that highlight specific metrics you need to focus on.
The final option is to use our MCP server to connect your email data with your AI tool to ask the tool to analyse your campaign performance with natural language prompts.
How does Apple Mail Privacy Protection affect email reporting?
Apple Mail Privacy Protection causes your email marketing platform to report emails sent to Apple Mail as opened.
This can cause your reported open rate to be higher than your actual open rate, and your reported click-to-open rate to be lower than your actual CTOR. Apple Mail Privacy Protection doesn’t impact metrics that don’t consider open rates, such as clicks, revenue, and orders.
What is a custom report in email marketing?
A custom report in email marketing is a dashboard that highlights all the metrics you choose to include, rather than the ones that the email tool’s main dashboards show you.
This allows you to see metrics around specific goals or targets or patterns. For example, you can see opens and orders in a single graph. The report then updates in real time and allows you to export the data.