Email marketing benchmarks by industry and region for 2026
 Davy and Martin, Finance
All athletes know how great it feels to beat a personal record. But sometimes it's nice to compare your results to others. Email benchmarks are the email marketing equivalent of world rankings.
They show the performance of email campaigns across an industry, so you can compare your campaigns to your competitors and see where you shine—or where there’s room to grow.
Using our internal data consisting of over 3.6 million campaigns, we’ve compiled a list of email marketing benchmarks to help guide your strategy. Use these alongside your internal KPIs to assess your campaigns and refine your goals for 2026.👇
Our email benchmarks use data from over 3.6 million campaigns
The benchmark data in this article covers millions of emails sent from hundreds of thousands of accounts.
Here is a breakdown of the data we used:
Includes over 3.6 million campaigns sent from 181,000 approved accounts
Covers a full year of data, from December 2024 to November 2025
Shows the median value for all benchmarks
The report shows benchmarks for open rate, click rate, click-to-open rate and unsubscribe rate. We show the overall benchmarks, as well as benchmarks for 46 separate industries and 7 regions.
Email marketing benchmarks across all industries
First, here are the overall email marketing benchmarks across all industries and the corresponding metrics from last year. Use these to see how your campaigns compare against all the accounts in our dataset. You can then dig deeper into the industry-specific data in the sections below.
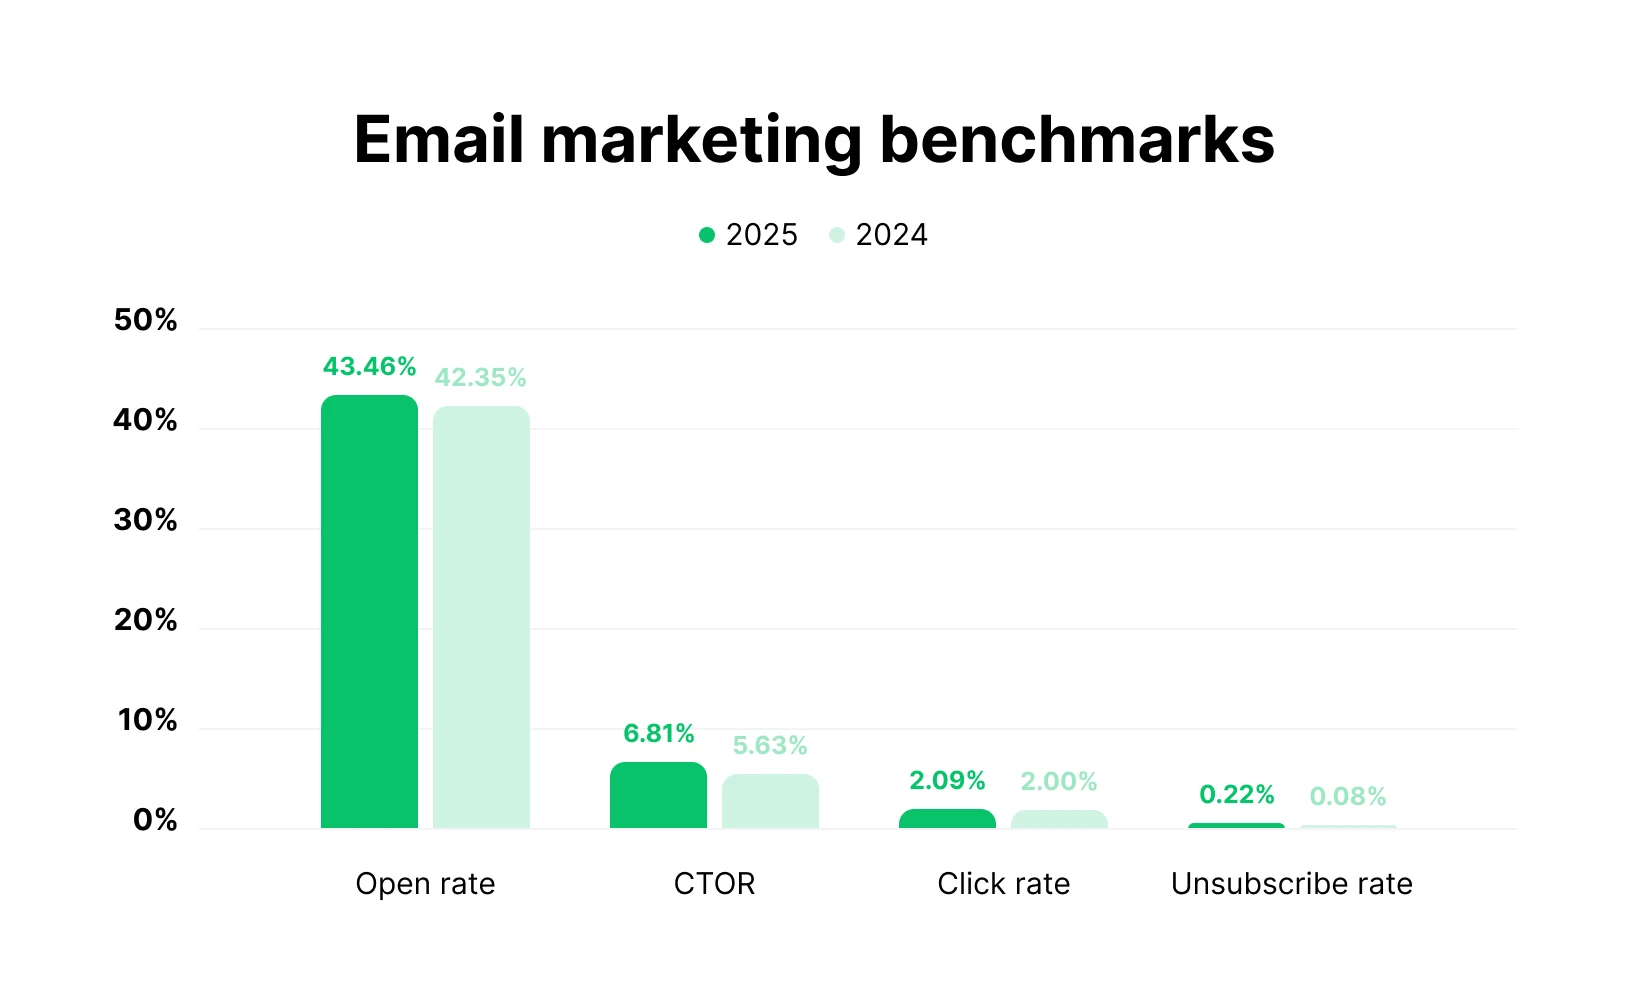
The average email open rate in 2025 was 43.46%. This was a slight increase on 2024’s average open rate of 42.35%.
The average email click-to-open rate in 2025 was 6.81%. This was an increase on 2024’s average click-to-open rate of 5.63%.
The average email click rate in 2025 was 2.09%. This was a slight increase on 2024’s average email click rate of 2%.
The average unsubscribe rate in 2025 was 0.22%. This was over double 2024’s unsubscribe rate of 0.08%.
What explains the year-on-year changes?
In 2025, opens, clicks and unsubscribe rates were all up. The latter is likely due to the Gmail changes that make it easier for people to unsubscribe from email lists in a click without ever opening the email.
You can now unsubscribe to emails via the unsubscribe option next to every mass email in your inbox, as well as via the manage subscriptions tab.
These changes will naturally result in more unsubscribes. Removing unengaged subscribers from your list means that the percentage of people who open and click will rise too.
What are good email marketing open and click rates by industry?
Here are good open and click rates for some of our most popular industries. If your metrics are around or above this number, you’re likely doing a great job!
The benchmark open rate for authors is 43.14% and the click rate is 2.75%
The benchmark open rate for e-commerce is 32.67% and the click rate is 1.07%
The benchmark open rate for consulting is 45.96% and the click rate is 2.41%
The benchmark open rate for health and fitness is 47.81% and the click rate is 1.45%
The benchmark open rate for non-profits is 52.38% and the click rate is 2.90%
The benchmark open rate for software and web apps is 39.31% and the click rate is 1.15%
Our data of 3.6 million campaigns sent from 181,000+ accounts includes benchmarks for 46 different industries. You can check the full data broken down by industry in the relevant sections below.
Apple Mail Privacy Protection automatically marks emails sent to Apple Mail clients as opened. This means real open rates are lower than the metrics you see in your dashboard and in this article. Your actual click-to-open rate will also be higher due to the inflated number of opens recorded.
We believe the benchmarks are still useful as everyone is impacted by these changes. Read more about how the Apple Privacy changes may have impacted your campaign metrics.
Email marketing open rate benchmarks
The median email open rate across all 3.6 million campaigns in our dataset was 43.46%. Email open rates by industry ranged from 30.1% to 55.71%. Open rate shows the percentage of the total campaign recipients who opened the email.
Email open rate by industry
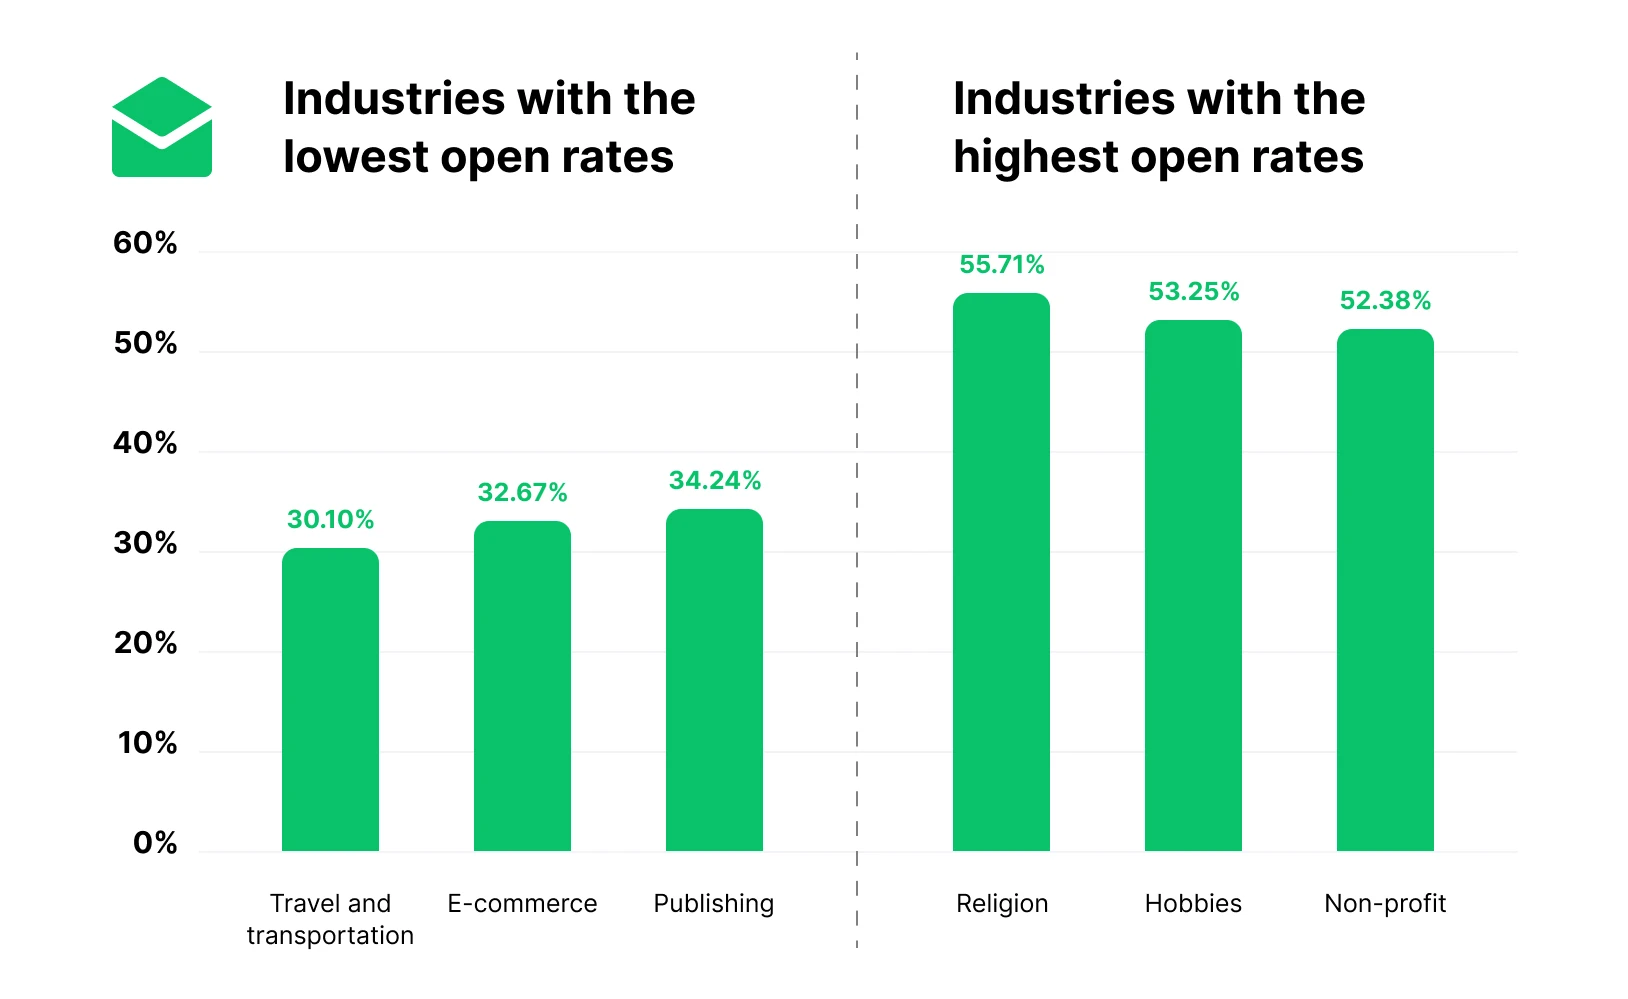
The industry with the highest email open rate was religion, which had an open rate of 55.71%. This was followed by hobbies (53.25%) and non-profit (52.38%).
This was the same top 3 as last year. It’s to see why these industries attract high open rates: People are passionate about these topics.
This year’s worst-performing industry was travel and transportation, which had an open rate of 30.10%. Following this were e-commerce (32.67%) and publishing (34.24%).
Check the full dataset below for all our open rate benchmarks by industry.
| Industry | Open rate benchmark |
|---|---|
| Agency | 40.52% |
| Agriculture and food services | 45.51% |
| Architecture and construction | 40.55% |
| Art gallery and museum | 50.43% |
| Artist | 49.23% |
| Author | 43.14% |
| Beauty and personal care | 38.4% |
| Blogger | 43.03% |
| Business and finance | 43.34% |
| Coaching | 48.07% |
| Computers and electronics | 35.29% |
| Construction | 39.95% |
| Consulting | 45.96% |
| Creative services/agency | 47.69% |
| e-commerce | 32.67% |
| Entertainment and events | 46% |
| Games | 41.35% |
| Government | 48.52% |
| Health and fitness | 47.81% |
| Higher education | 43.98% |
| Hobbies | 53.25% |
| Home and garden | 39.18% |
| Insurance | 44.4% |
| Legal | 42.58% |
| Manufacturing | 37.36% |
| Marketing and advertising | 37.23% |
| Media | 42.97% |
| Medical, dental, and healthcare | 43.75% |
| Music and musicians | 45.93% |
| Non-profit | 52.38% |
| Online courses | 43.1% |
| Other | 44.9% |
| Photo and video | 49.98% |
| Politics | 47.19% |
| Public relations | 47.18% |
| Publishing company | 34.24% |
| Real estate | 40.37% |
| Recruitment and staffing | 45.26% |
| Religion | 55.71% |
| Restaurants and cafes | 44.32% |
| Retail | 37.47% |
| Software and web app | 39.31% |
| Sports | 47.69% |
| Telecommunications | 37.21% |
| Travel and transportation | 30.1% |
Email open rate by region
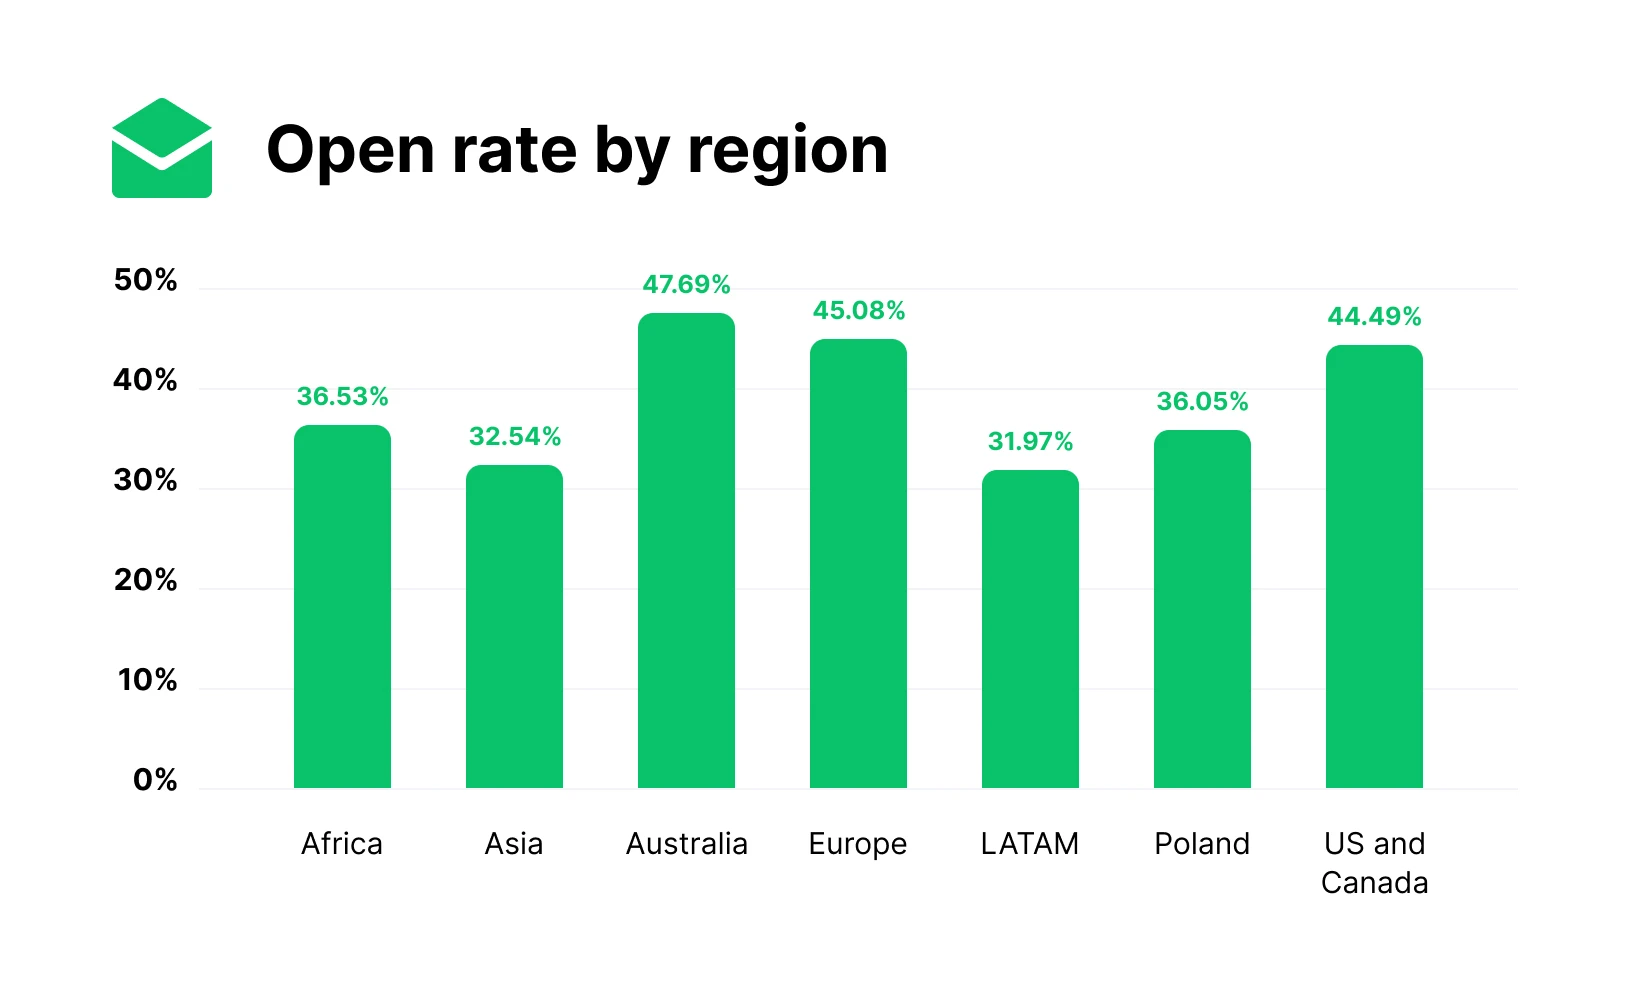
We also broke down all our benchmarks by region so you can compare your email marketing strategy performance to others in your geographical area.
You can see data for Africa, Asia, Australia, Europe, LATAM, US and Canada, and Poland. We included Poland as a separate category since we have a high number of Polish customers.
Checking benchmarks specific to your region is important, as different regions have different email habits that can impact the metrics you receive.
For example, Australia, the U.S. and Canada all have:
High iPhone ownership, which could see more emails marked as open by Apple Mail Privacy Protection, resulting in higher open rates
High consumer preference for receiving content via email
But, many countries in Africa, Asia and LATAM have:
Lower levels of iPhone ownership, making them less likely to be impacted by Apple Mail Privacy Protection
An expectation to receive promotional content via messaging apps like WhatsApp or Line, as well as email
At 47.69%, campaigns sent in Australia had the highest open rate, while those sent in LATAM had the lowest, at 31.97%.
| Region | Click rate |
|---|---|
| Africa | 36.53% |
| Asia | 32.54% |
| Australia | 47.69% |
| Europe | 45.08% |
| LATAM | 31.97% |
| Poland | 36.05% |
| US and Canada | 44.49% |
Email marketing click rate benchmarks
The average email click rate across all 3.6 million email marketing campaigns was 2.09%. Click rates across industries ranged from 0.83% to 4.90%. Email click rate (also known as click-through rate) shows the percentage of email recipients who clicked on a link in your message.
Considering how Apple’s Privacy changes impact open rate and CTOR, click rate is currently the most accurate indicator of email newsletter engagement since it’s not reliant on tracking opens.
However, email click rate is impacted by having links to click on. If you don’t include many links in your emails, your click rate will be low, but it doesn’t mean people aren’t reading your content.
Email click rate by industry
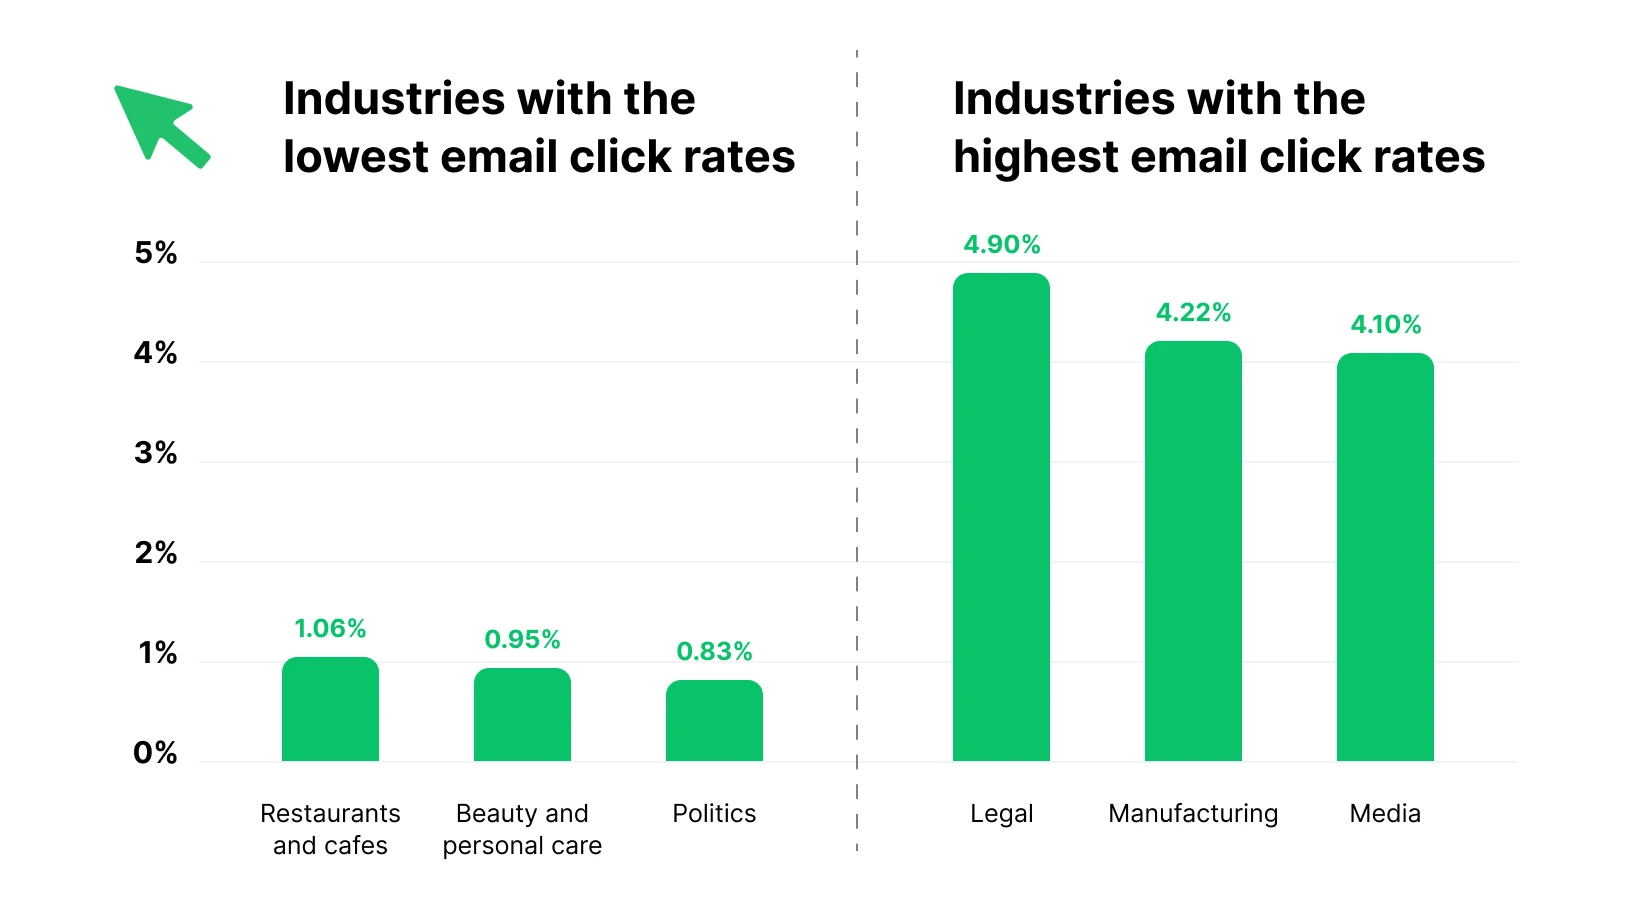
The industry with the highest email click rate was legal. An impressive 4.90% of recipients clicked on these messages. This was followed by manufacturing (4.22%) and media (4.10%).
The industry with the lowest click rate was politics, which had a click rate of just 0.83%. This was followed by the beauty and personal care (0.95%) and restaurant and cafes industries (1.06%).
See the full dataset below to check the benchmarks for your industry.
| Industry | Click rate benchmark |
|---|---|
| Agency | 1.85% |
| Agriculture and food services | 1.83% |
| Architecture and construction | 1.68% |
| Art gallery and museum | 2.66% |
| Artist | 2.52% |
| Author | 2.75% |
| Beauty and personal care | 0.95% |
| Blogger | 3% |
| Business and finance | 2.37% |
| Coaching | 1.42% |
| Computers and electronics | 1.37% |
| Construction | 3.53% |
| Consulting | 2.41% |
| Creative services/agency | 1.87% |
| e-commerce | 1.07% |
| Educational institution | 1.93% |
| Entertainment and events | 1.28% |
| Games | 2.11% |
| Government | 3.05% |
| Health and fitness | 1.45% |
| Higher education | 2.15% |
| Hobbies | 3.3% |
| Home and garden | 1.75% |
| Insurance | 1.36% |
| Legal | 4.9% |
| Manufacturing | 4.22% |
| Marketing and advertising | 1.3% |
| Media | 4.1% |
| Medical, dental, and healthcare | 2.25% |
| Music and musicians | 1.7% |
| Non-profit | 2.9% |
| Online courses | 1.39% |
| Other | 2.15% |
| Photo and video | 1.59% |
| Politics | 0.83% |
| Public relations | 2.02% |
| Publishing company | 2.82% |
| Real estate | 1.72% |
| Recruitment and staffing | 1.68% |
| Religion | 2.95% |
| Restaurants and cafes | 1.06% |
| Retail | 1.27% |
| Software and web app | 1.15% |
| Sports | 1.27% |
| Telecommunications | 1.49% |
| Travel and transportation | 1.68% |
Email click rate by region
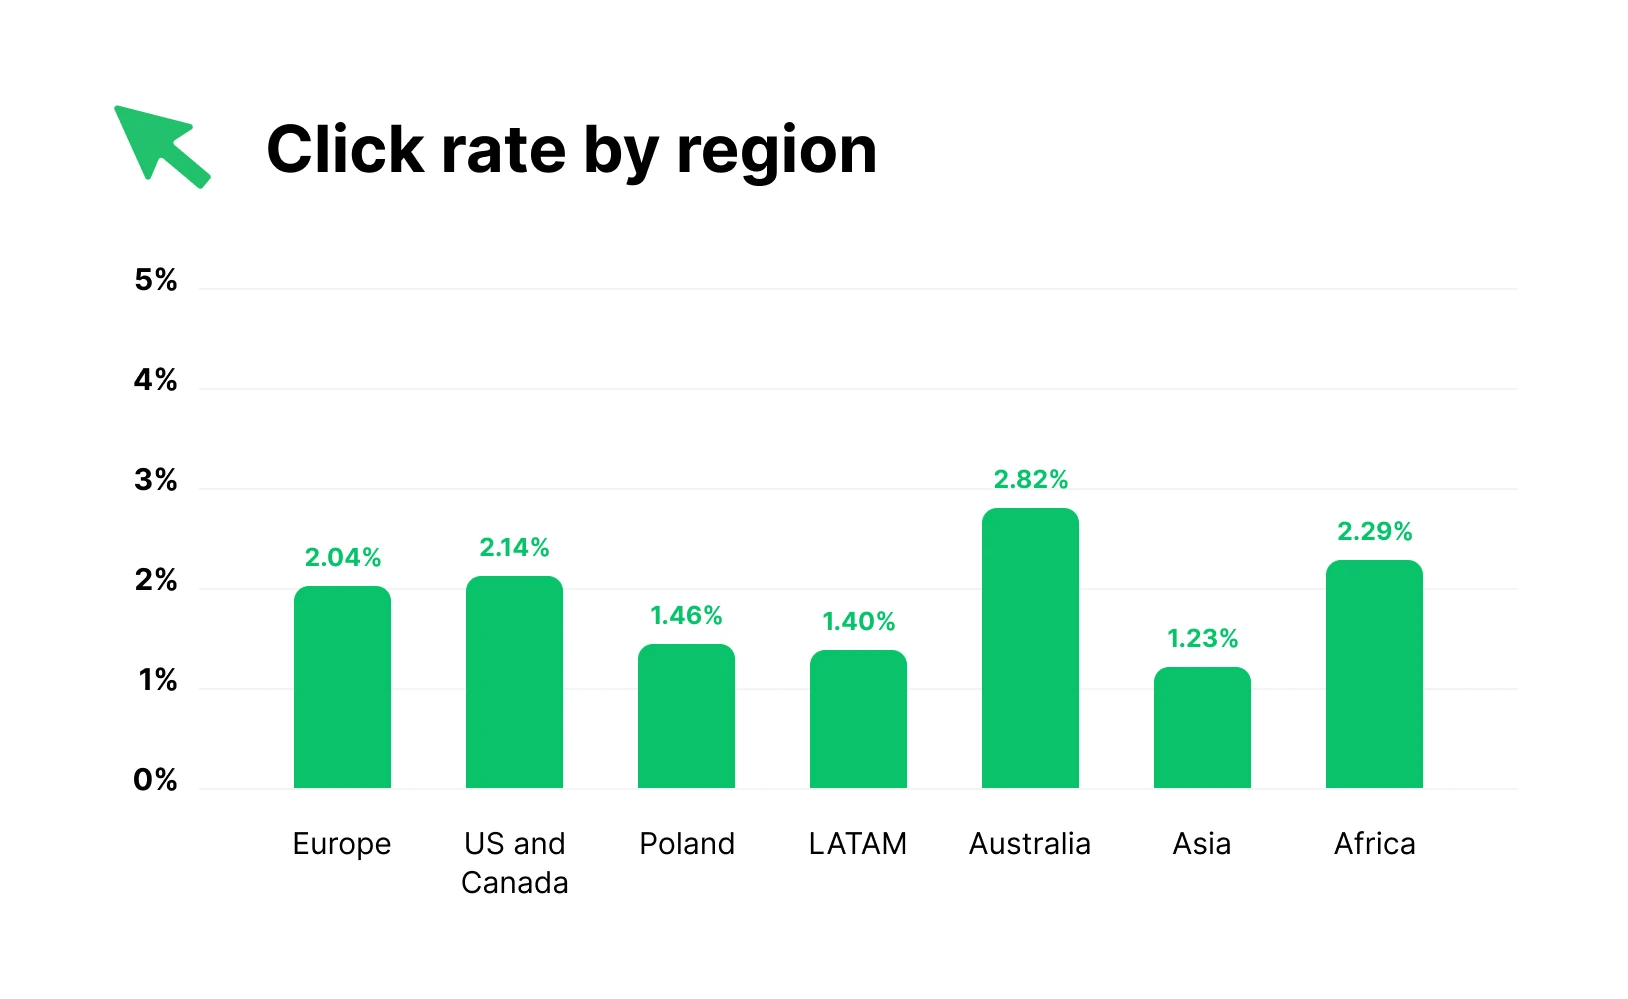
Emails sent in Australia had the highest click rate at 2.82%, while those sent in Asia had the lowest at 1.23%.
The general pattern across the region data is, unsurprisingly, that regions with high open rates also have high click rates. But, despite having the third-lowest average open rate, Africa has the second-highest email click rate.
| Region | Click rate |
|---|---|
| Africa | 2.29% |
| Asia | 1.23% |
| Australia | 2.82% |
| Europe | 2.04% |
| LATAM | 1.40% |
| Poland | 1.46% |
| US and Canada | 2.14% |
Email marketing click-to-open rate benchmarks
The median email click-to-open rate across all email marketing campaigns was 6.81%. Click-to-open rates across industries ranged from 2.96% to 14.82%. Click-to-open rate (CTOR) shows the percentage of the people who open your email who also click on it.
CTOR is a useful metric because it can show how engaging your email content is. A low open rate with a high CTOR suggests that the people who open your emails find the content relevant. In this situation, increasing your open rate would likely boost overall campaign performance.
Email click-to-open rate by industry
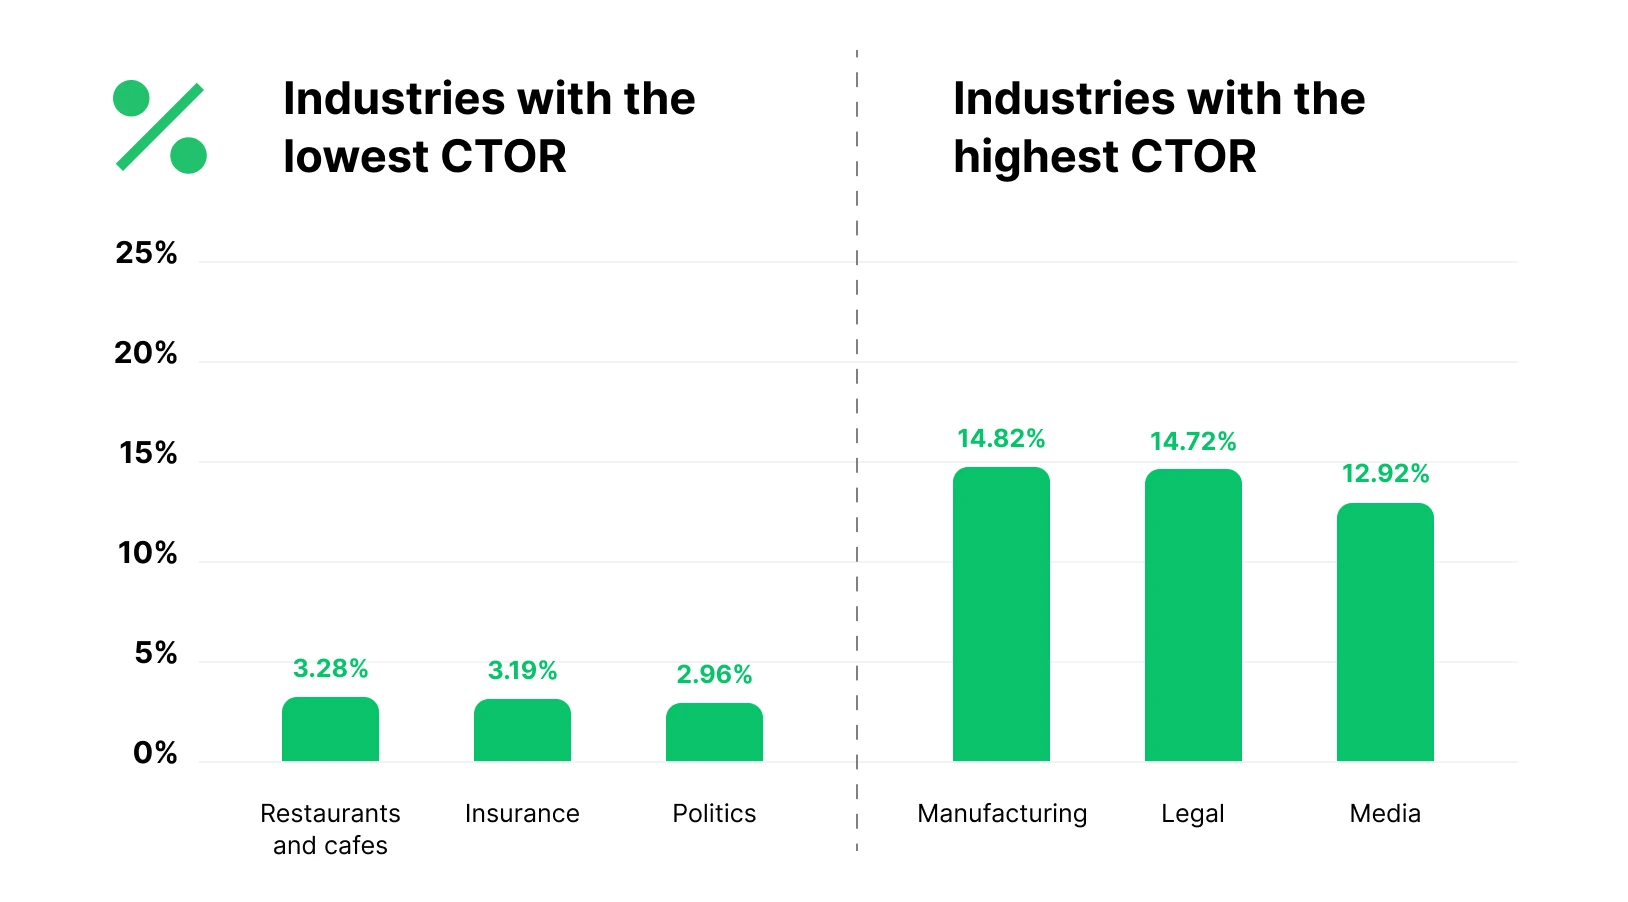
The industry with the highest CTOR is manufacturing. An impressive 14.82% of people who open these emails also click on them. The second and third-placed industries by CTOR are legal (14.72%) and media (12.92%).
The 3 industries with the lowest CTOR are politics (2.96%), insurance (3.19%), and restaurants and cafes (3.28%).
See the full dataset below to check the benchmarks for your industry.
| Industry | Click-to-open rate benchmark |
|---|---|
| Agency | 6.74% |
| Agriculture and food services | 6.21% |
| Architecture and construction | 6.1% |
| Art gallery and museum | 6.28% |
| Artist | 7.45% |
| Author | 7.81% |
| Beauty and personal care | 3.91% |
| Blogger | 8.56% |
| Business and finance | 7.96% |
| Coaching | 4.9% |
| Computers and electronics | 4.83% |
| Construction | 12.38% |
| Consulting | 7.67% |
| Creative services/agency | 5.53% |
| e-commerce | 4.01% |
| Educational institution | 7.03% |
| Entertainment and events | 3.7% |
| Games | 9.71% |
| Government | 8.44% |
| Health and fitness | 4.45% |
| Higher education | 9.15% |
| Hobbies | 8.45% |
| Home and garden | 7.05% |
| Insurance | 3.19% |
| Legal | 14.72% |
| Manufacturing | 14.82% |
| Marketing and advertising | 6.09% |
| Media | 12.92% |
| Medical, dental, and healthcare | 7.31% |
| Music and musicians | 5.42% |
| Non-profit | 8.24% |
| Online courses | 5.23% |
| Other | 6.86% |
| Photo and video | 4.84% |
| Politics | 2.96% |
| Public relations | 6.18% |
| Publishing company | 9.12% |
| Real estate | 6.72% |
| Recruitment and staffing | 5.29% |
| Religion | 7.58% |
| Restaurants and cafes | 3.28% |
| Retail | 4.51% |
| Software and web app | 5.4% |
| Sports | 3.35% |
| Telecommunications | 4.54% |
| Travel and transportation | 6.34% |
Email click-to-open rate by region
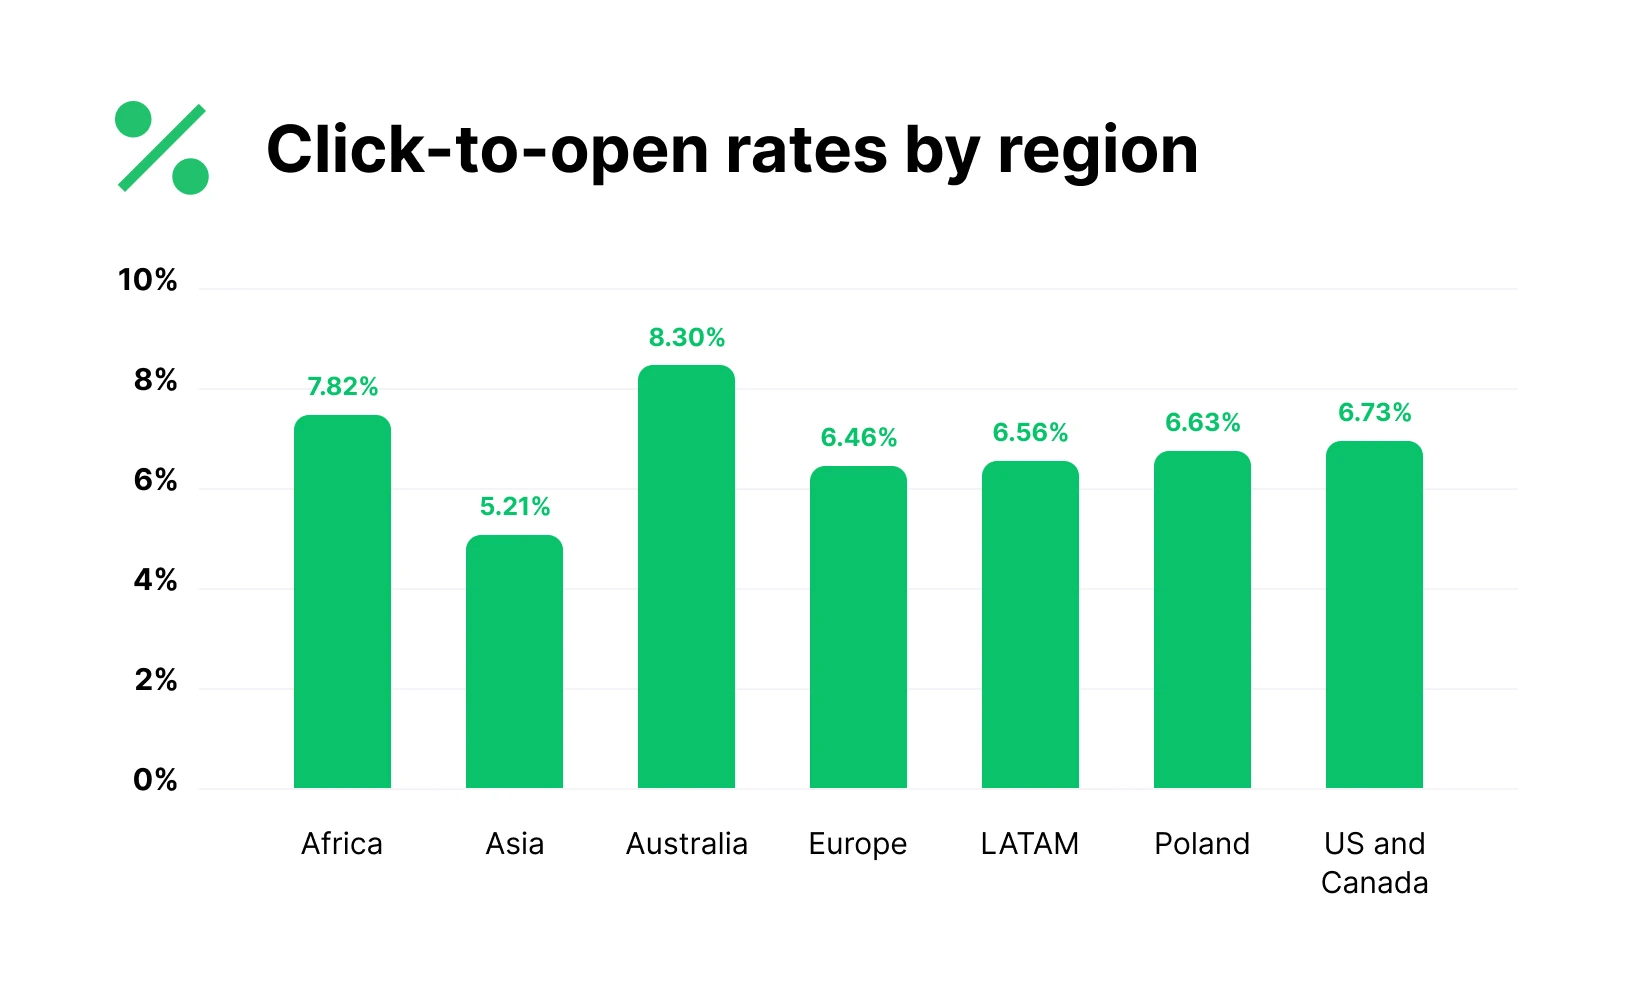
CTOR rankings by region were quite consistent. Emails sent in Australia had the highest click-to-open rate at 8.3%, while those sent in Asia had the lowest at 5.21%.
| Region | Click-to-open rate |
|---|---|
| Africa | 7.82% |
| Asia | 5.21% |
| Australia | 8.30% |
| Europe | 6.46% |
| LATAM | 6.56% |
| Poland | 6.63% |
| US and Canada | 6.73% |
Email marketing unsubscribe rate benchmarks
The median unsubscribe rate across all campaigns was 0.22%. This is higher than in 2024, when it was 0.08%. This is likely due to the changes made by Gmail that make it easier for people to unsubscribe from promotional emails. Unsubscribe rate is the percentage of recipients who click the unsubscribe link in your email.
The good news for email marketers is that even with these changes, only a tiny percentage of people unsubscribe when you send an email. And remember, it’s always better to have a smaller list that engages with your content than a larger one that never opens your emails.
Email unsubscribe rate by industry
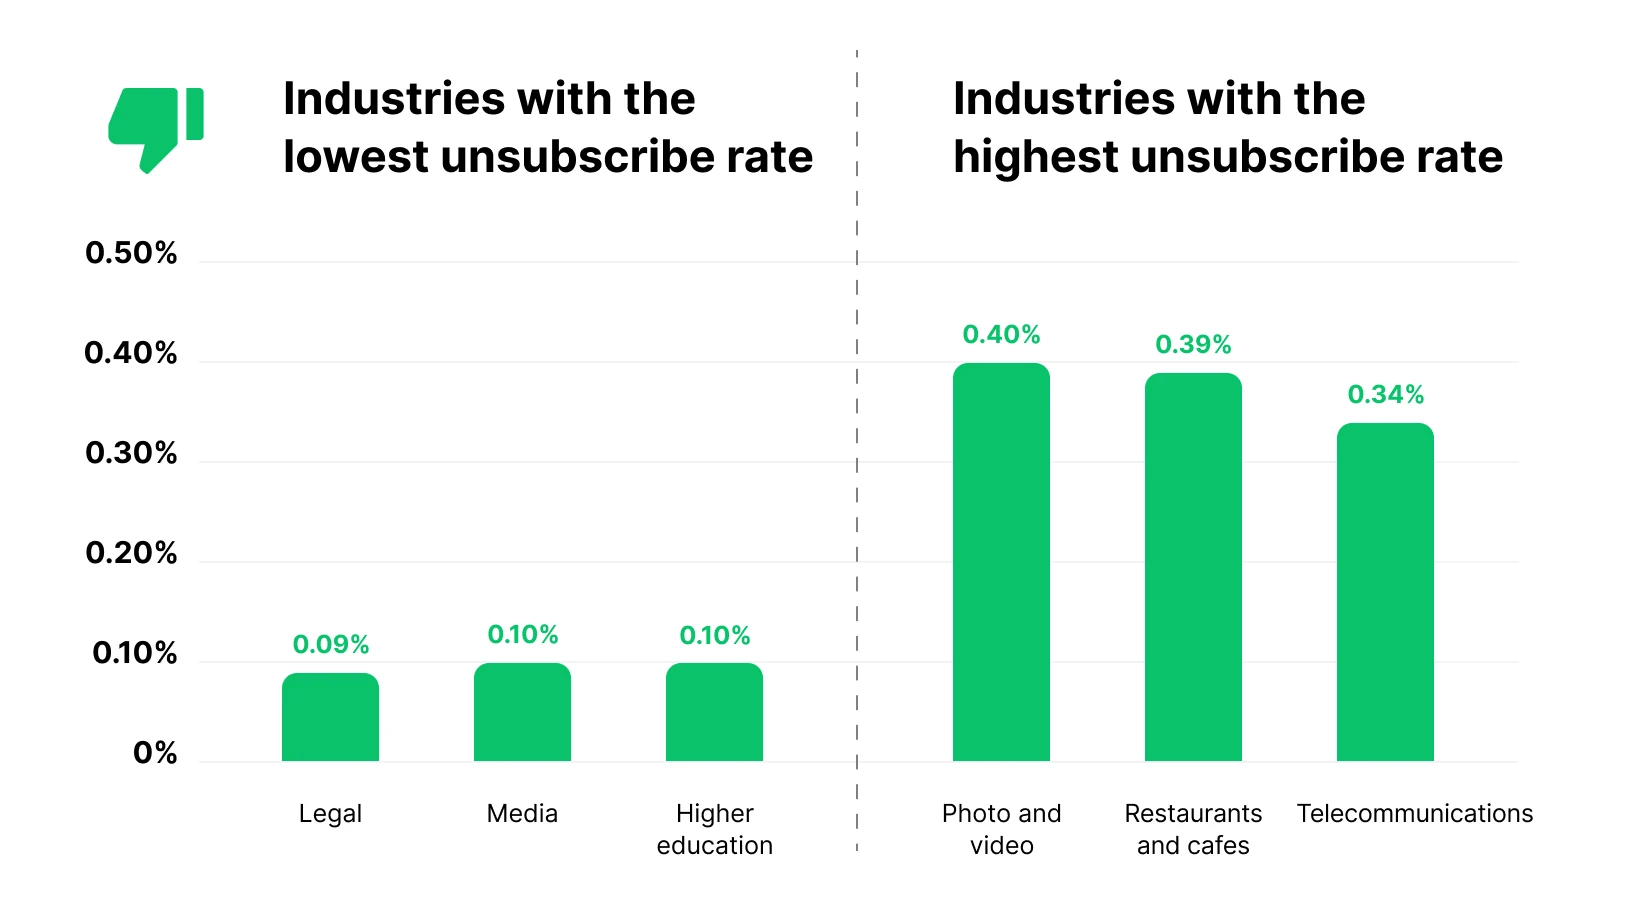
The industry with the highest unsubscribe rate was photo and video, at 0.40%. Restaurants and cafes (0.39%) and telecommunications (0.34%) were the second and third highest. While the highest in our dataset, these rates mean that only 3.4 to 4 people out of 1,000 recipients unsubscribe.
At the other end of the scale, the legal industry had the lowest unsubscribe rate at just 0.09%. This was followed by Media and Higher education, which both had an unsubscribe rate of 0.1%.
See the full dataset below to check the benchmarks for your industry.
| Industry | Unsubscribe rate benchmark |
|---|---|
| Agency | 0.21% |
| Agriculture and food services | 0.23% |
| Architecture and construction | 0.23% |
| Art gallery and museum | 0.33% |
| Artist | 0.27% |
| Author | 0.31% |
| Beauty and personal care | 0.23% |
| Blogger | 0.16% |
| Business and finance | 0.16% |
| Coaching | 0.3% |
| Computers and electronics | 0.17% |
| Construction | 0.27% |
| Consulting | 0.23% |
| Creative services/agency | 0.29% |
| e-commerce | 0.18% |
| Educational institution | 0.17% |
| Entertainment and events | 0.24% |
| Games | 0.25% |
| Government | 0.22% |
| Health and fitness | 0.3% |
| Higher education | 0.1% |
| Hobbies | 0.23% |
| Home and garden | 0.23% |
| Insurance | 0.27% |
| Legal | 0.09% |
| Manufacturing | 0.3% |
| Marketing and advertising | 0.15% |
| Media | 0.1% |
| Medical, dental, and healthcare | 0.2% |
| Music and musicians | 0.23% |
| Non-profit | 0.19% |
| Online courses | 0.23% |
| Other | 0.22% |
| Photo and video | 0.4% |
| Politics | 0.14% |
| Public relations | 0.14% |
| Publishing company | 0.2% |
| Real estate | 0.16% |
| Recruitment and staffing | 0.24% |
| Religion | 0.13% |
| Restaurants and cafes | 0.39% |
| Retail | 0.22% |
| Software and web app | 0.2% |
| Sports | 0.16% |
| Telecommunications | 0.34% |
| Travel and transportation | 0.13% |
Unsubscribe rate by region
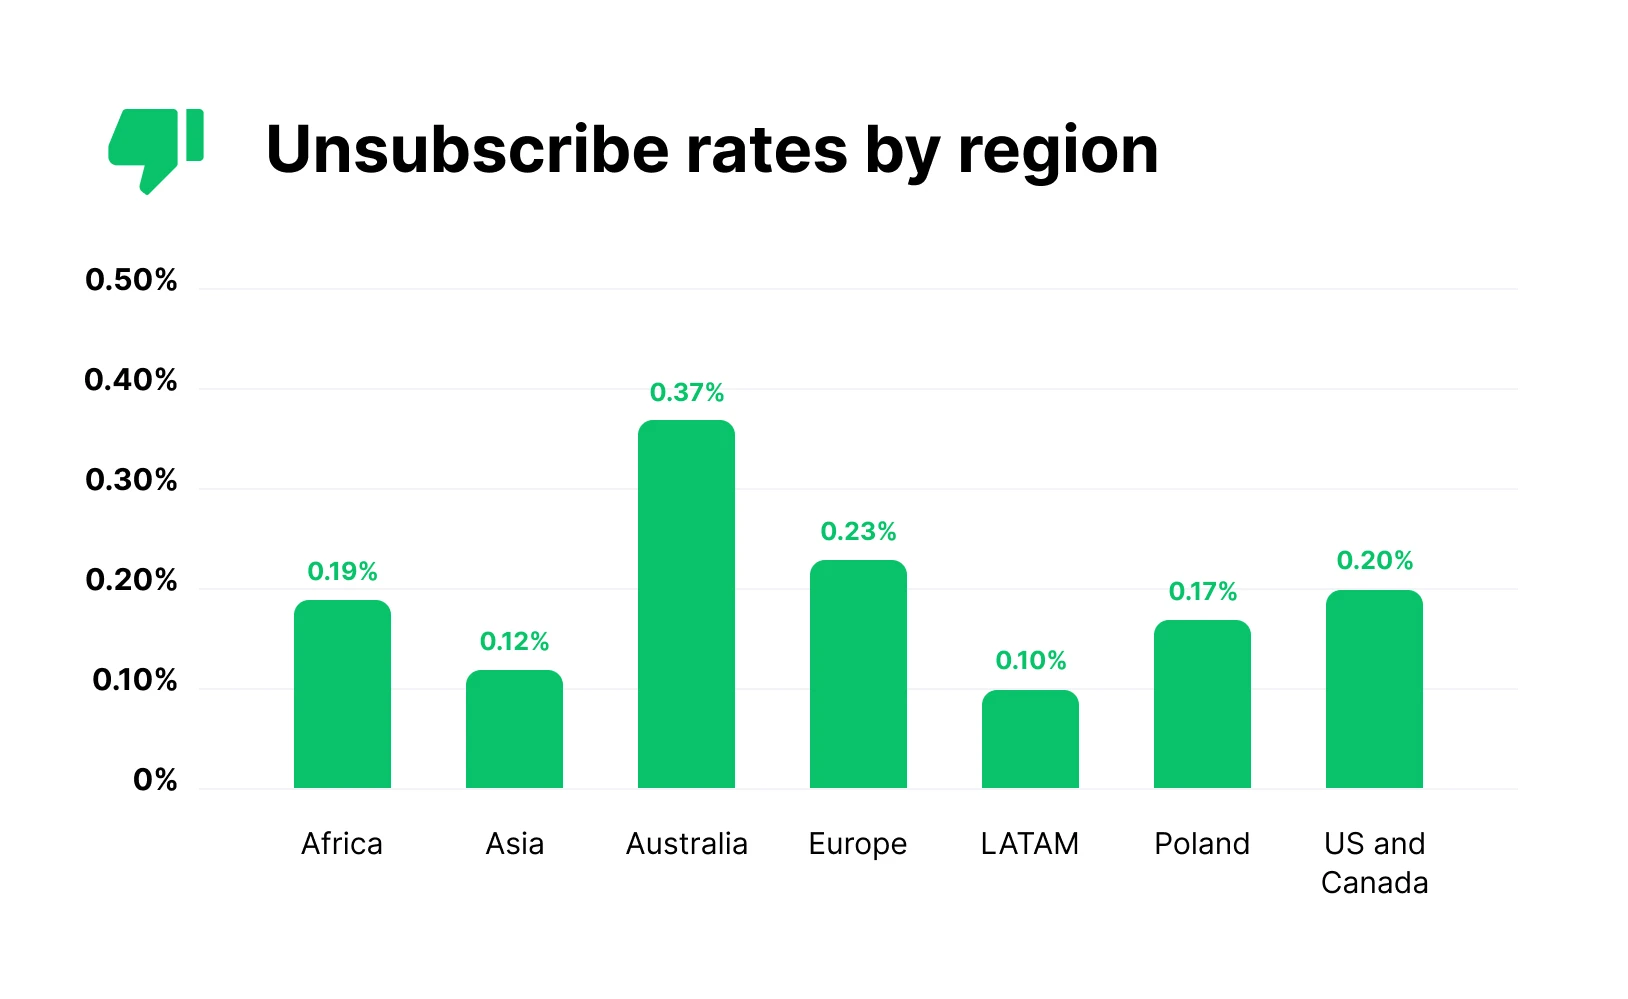
Australia combined the highest open rate of any region with the highest unsubscribe rate at 0.37%. A high open rate with a high unsubscribe rate may sound counterintuitive, but it actually makes sense since people are more likely to unsubscribe if they see and open your emails than if they never interact with them.
LATAM had the lowest unsubscribe rate at 0.10%, and also the lowest open rate, supporting the above theory.
| Region | Unsubscribe rate |
|---|---|
| Africa | 0.19% |
| Asia | 0.12% |
| Australia | 0.37% |
| Europe | 0.23% |
| LATAM | 0.10% |
| Poland | 0.17% |
| US and Canada | 0.20% |
How to improve email success metrics today
Whether your current metrics are falling below the industry standards or you want to outshine the competition, here are 4 ways to start improving your email success metrics right now.
1. How to increase email open rate
Increasing your open rate typically comes down to sending more relevant content and writing the subject line in a way that makes people most likely to open.
We ran a study earlier this year that identified several ways you can increase your email open rate. Here’s what we found:
Use a subject line between 20 and 40 characters: The most opened campaigns are 45% more likely to be this length.
Send targeted content: The most opened campaigns are 28% more likely to use subscriber filters like groups or segments
Use the custom preheader: Top campaigns were 23% more likely to use a custom preheader
Use an emoji: Top campaigns were 21% more likely to include an emoji in the subject line. It helps them stand out!
Use a personal sender name: We ran an A/B test that showed personal sender names resulted in 3.81% more opens
Send at the right time: Our email send time study found that emails sent between 3 PM and 7 PM get the most opens
Use automation: Automated emails get way higher open rates than regular campaigns. Consider creating automated emails if it makes sense for the content.
Remove inactive subscribers: This is the easiest way to increase open rates: stop sending to people who don’t open your campaigns! You can easily identify these people in the Subscribers section of your MailerLite dashboard
2. How to increase email clicks
Increasing your clicks ultimately comes down to providing more content that people want to click on. More clicks will improve both your click rate and your click-to-open rate.
Here are some ideas for how to do this.
Give subscribers more things to click on! Add blog post links, surveys, quizzes, resource libraries, or anything else that is useful to your target audience
Align the subject line with the main CTA
Improve the relevancy of your content
Design buttons and links so they're prominently displayed
Make the copy and CTA more engaging
Use dynamic content to show relevant offers
Add interactive content like surveys and quizzes
3. How to decrease unsubscribes
You can’t get rid of unsubscribes entirely, but you can keep them to a minimum by following these best practices:
Use double opt-in for signups to ensure that only people who want to receive your emails join your list. This will also decrease your email bounce rate
Send your campaigns more frequently to build a relationship with readers, and stick to a regular schedule
Regularly clean your email list with an email validation tool
Make your email content more relevant to your subscribers' interests and needs
Make sure your subject line reflects the content in your email so you meet the reader's expectations
Minimizing unsubscribes will also keep your email deliverability healthy since it shows that you’re only sending to people who want to hear from you.
Did you know that you can create an automated flow that delivers your email to each individual at the perfect time? It’s really easy to do, read our ultimate guide to email marketing automation to find out more.
It's goal-setting time!
How did your email metrics compare to those in your industry? Knowing the email benchmarks of competing businesses helps you set up smarter goals and work to improve your email campaigns.
To start improving your campaigns, we recommend the following steps:
Pick a metric that is underperforming or that you want to improve.
Analyze your past campaigns to discover subject lines, topics or offers that performed better or worse than average. Use our MCP server connected to your favorite AI tool like ChatGPT or Claude to gather this information. Just use natural language prompts to analyze your data and discover patterns you can use to improve performance.
Start running A/B tests using the tactics in the How to improve email success metrics today section to see which changes make a difference.
As you run more A/B tests, you’ll start to get a clear picture of the types of things that your audience responds to. These learnings will start piling up, and as you learn more about your audience, you’ll see improvements in your engagement metrics.
Hit your goals with MailerLite
MailerLite has all the features you need to succeed at email marketing this year. Take it for a test drive with a 14-day free trial of all premium features.
Editor's note: This post was originally published in January 2020 and has been updated with new benchmark data.